trade with discipline
A trading journal that takes your psychology as seriously as your P&L.
See why you really lose. Not another spreadsheet.
- Free while in early access
- No card, no trial timer
- Your journal stays in the EU
- Export everything, any tier
Not financial advice. A journal and analytics tool that never tells you what to trade.
A read on discipline and consistency, not your P&L. Built from behaviour, evidence-gated against your own trade history.
Sample score, for illustration.
The edge
Everyone shows an equity curve. Almost nobody shows you the gap between how sure you felt and how right you were.
See the leak before it breaks your account
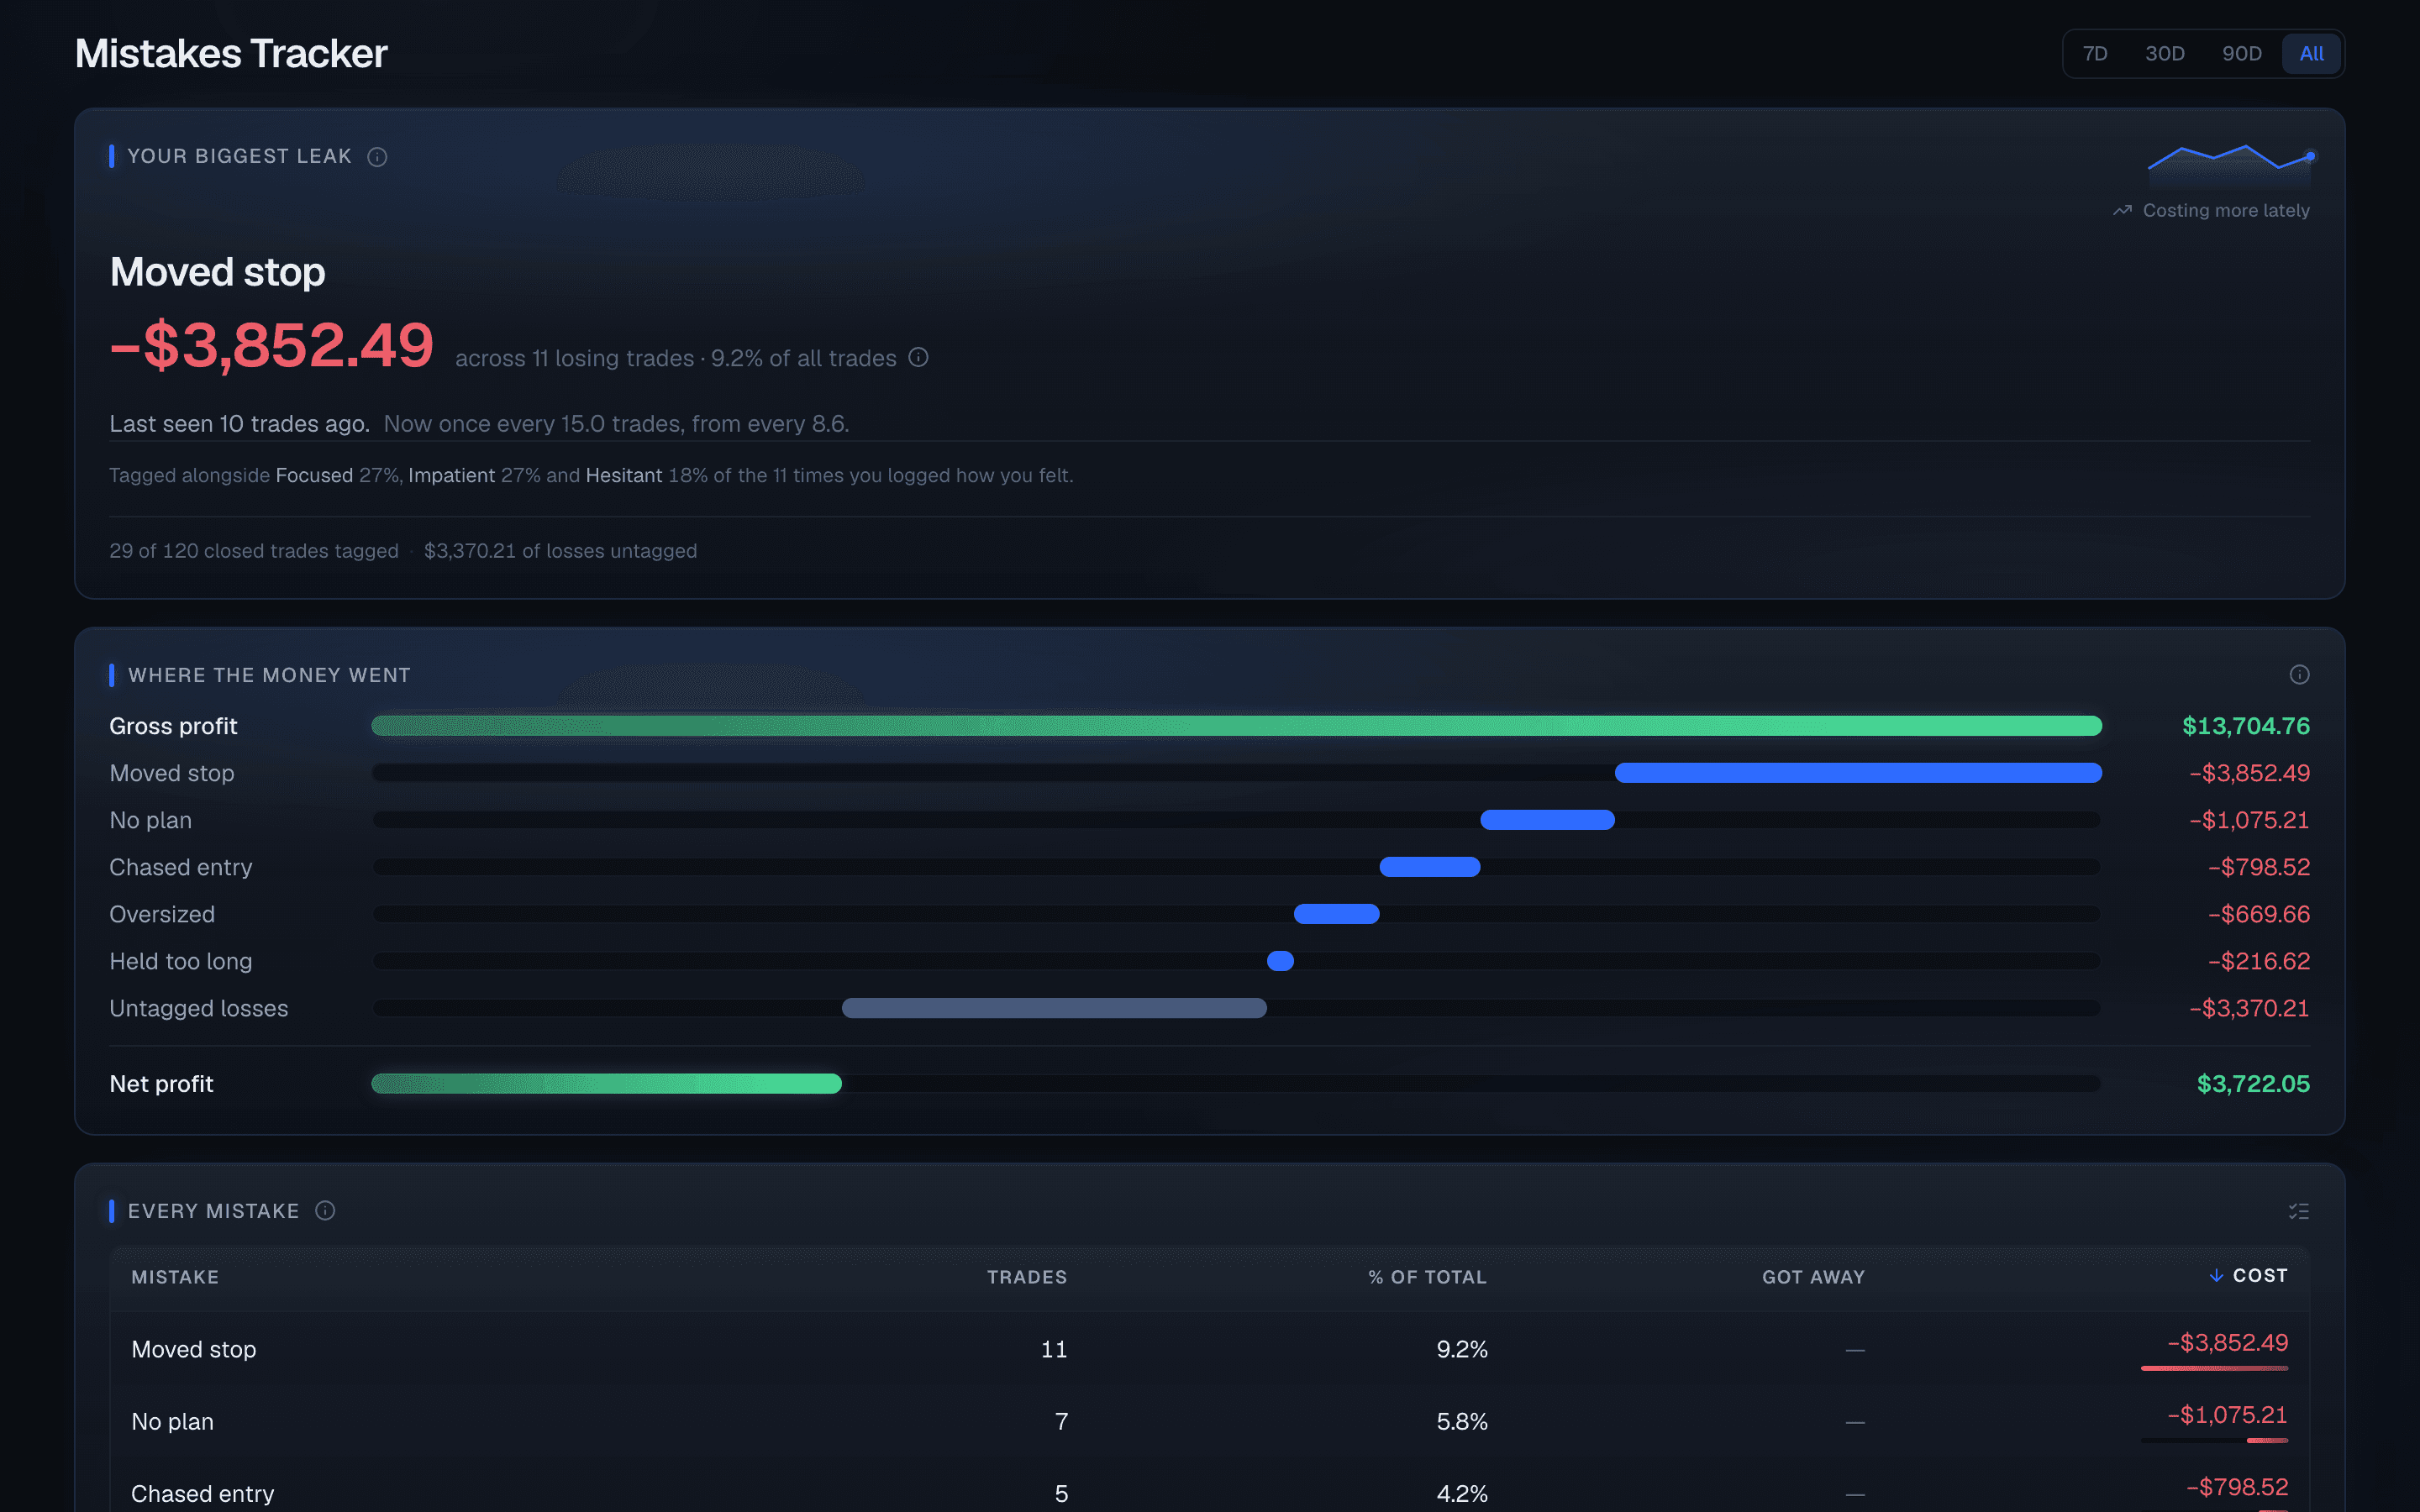
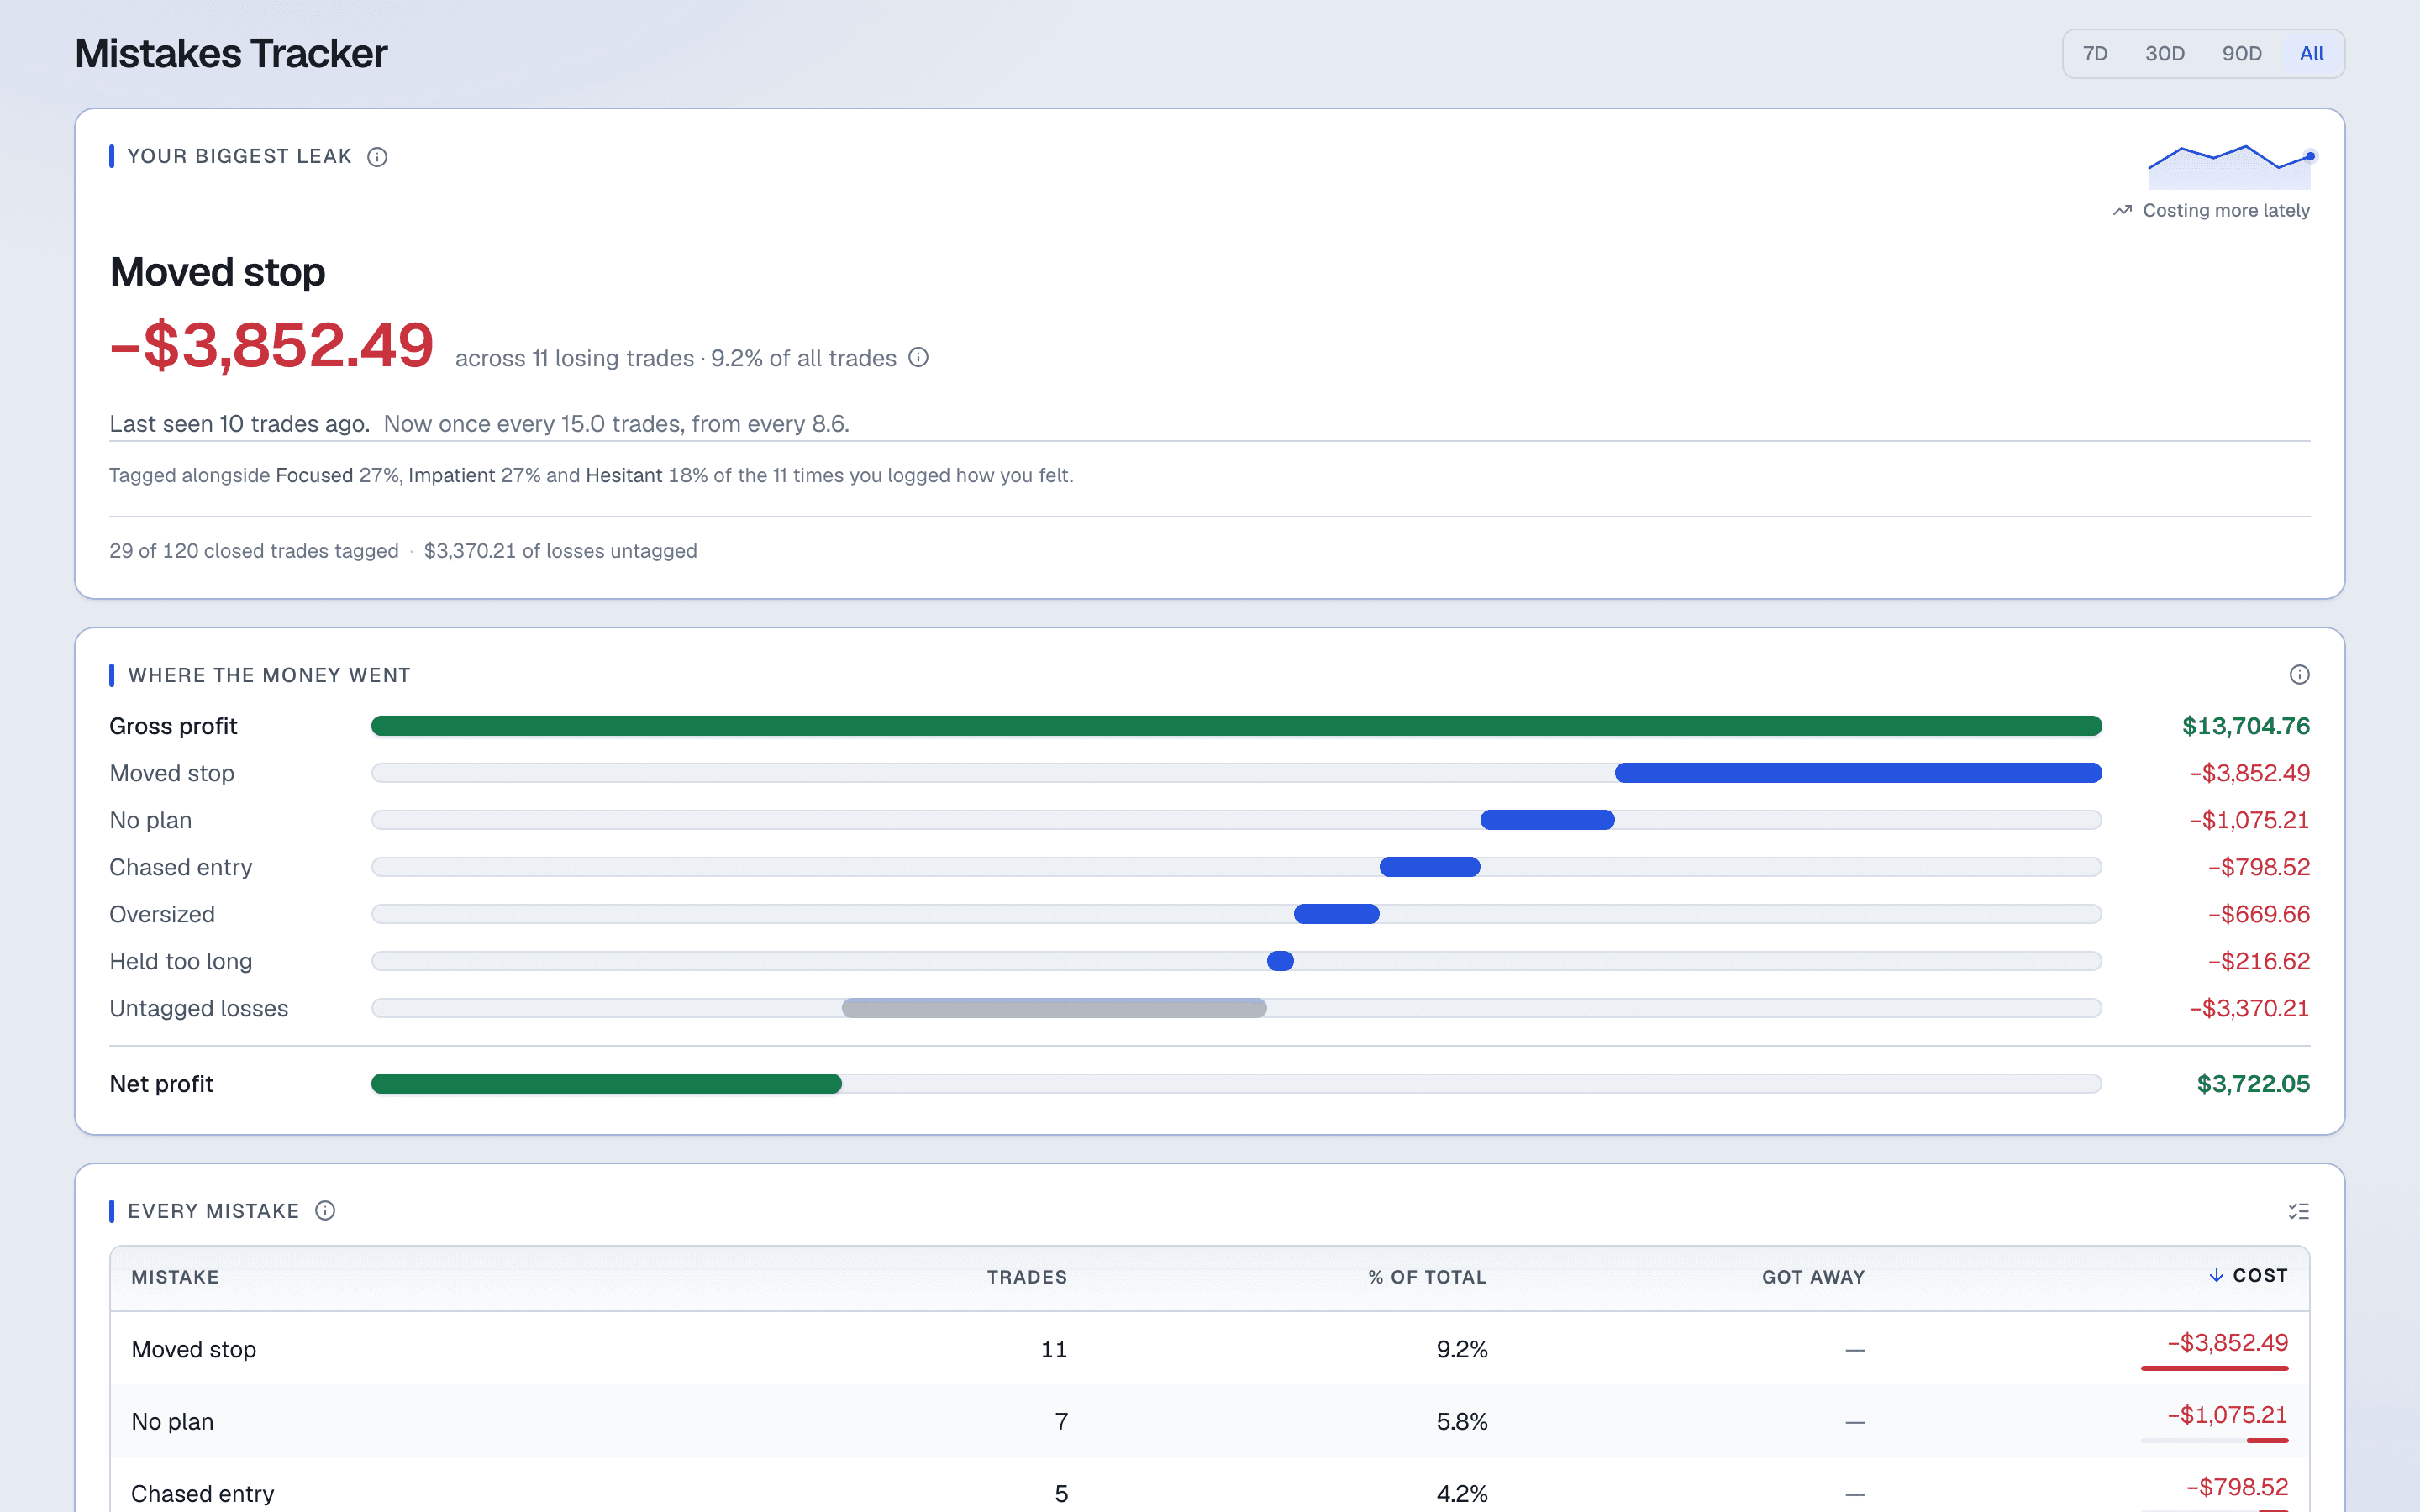
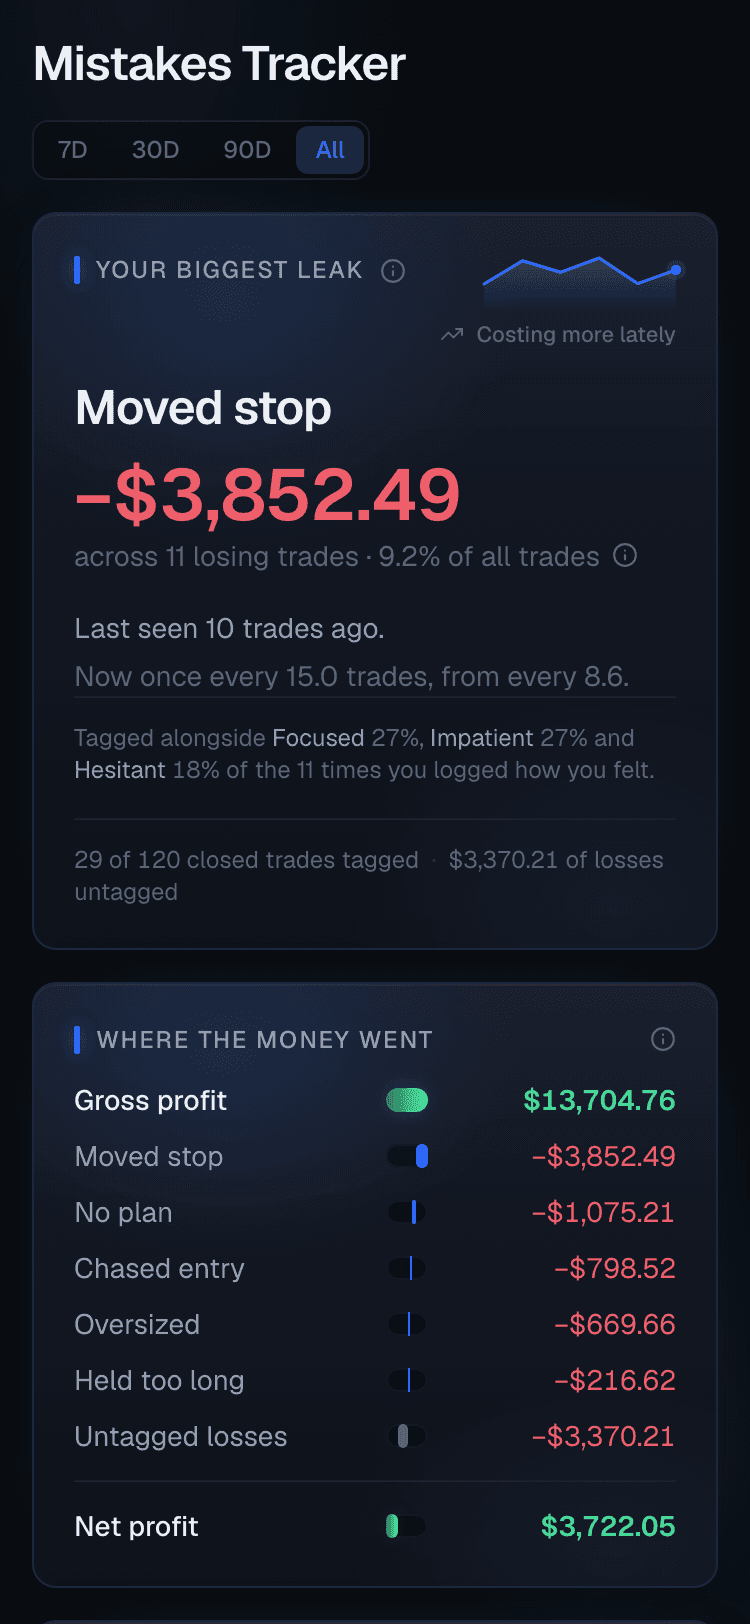
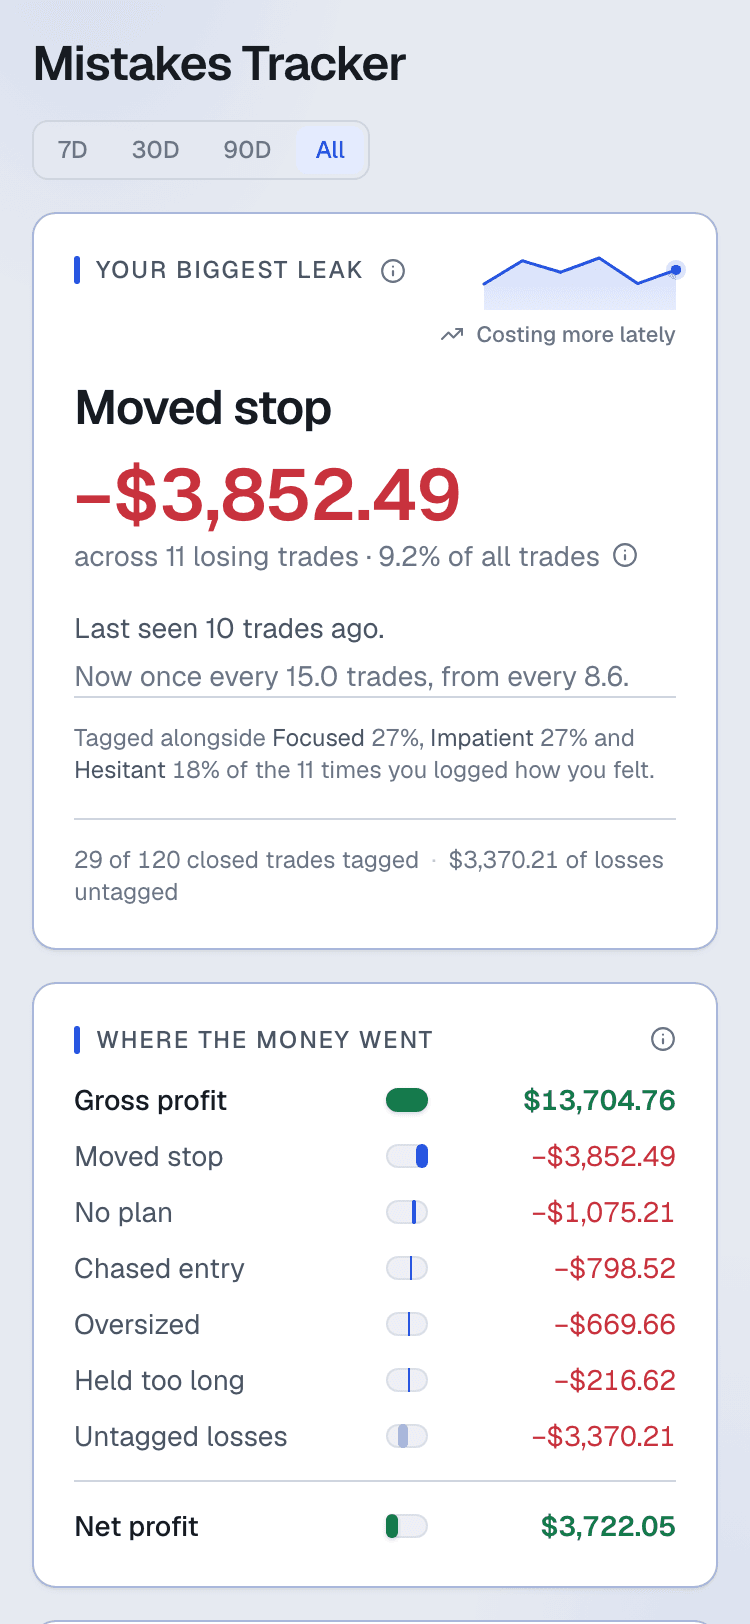
The Mistakes Tracker surfaces your single biggest leak with a trend line, plus a waterfall of every tagged mistake, so the pattern shows up before the drawdown does.
Know whether your confidence is earned
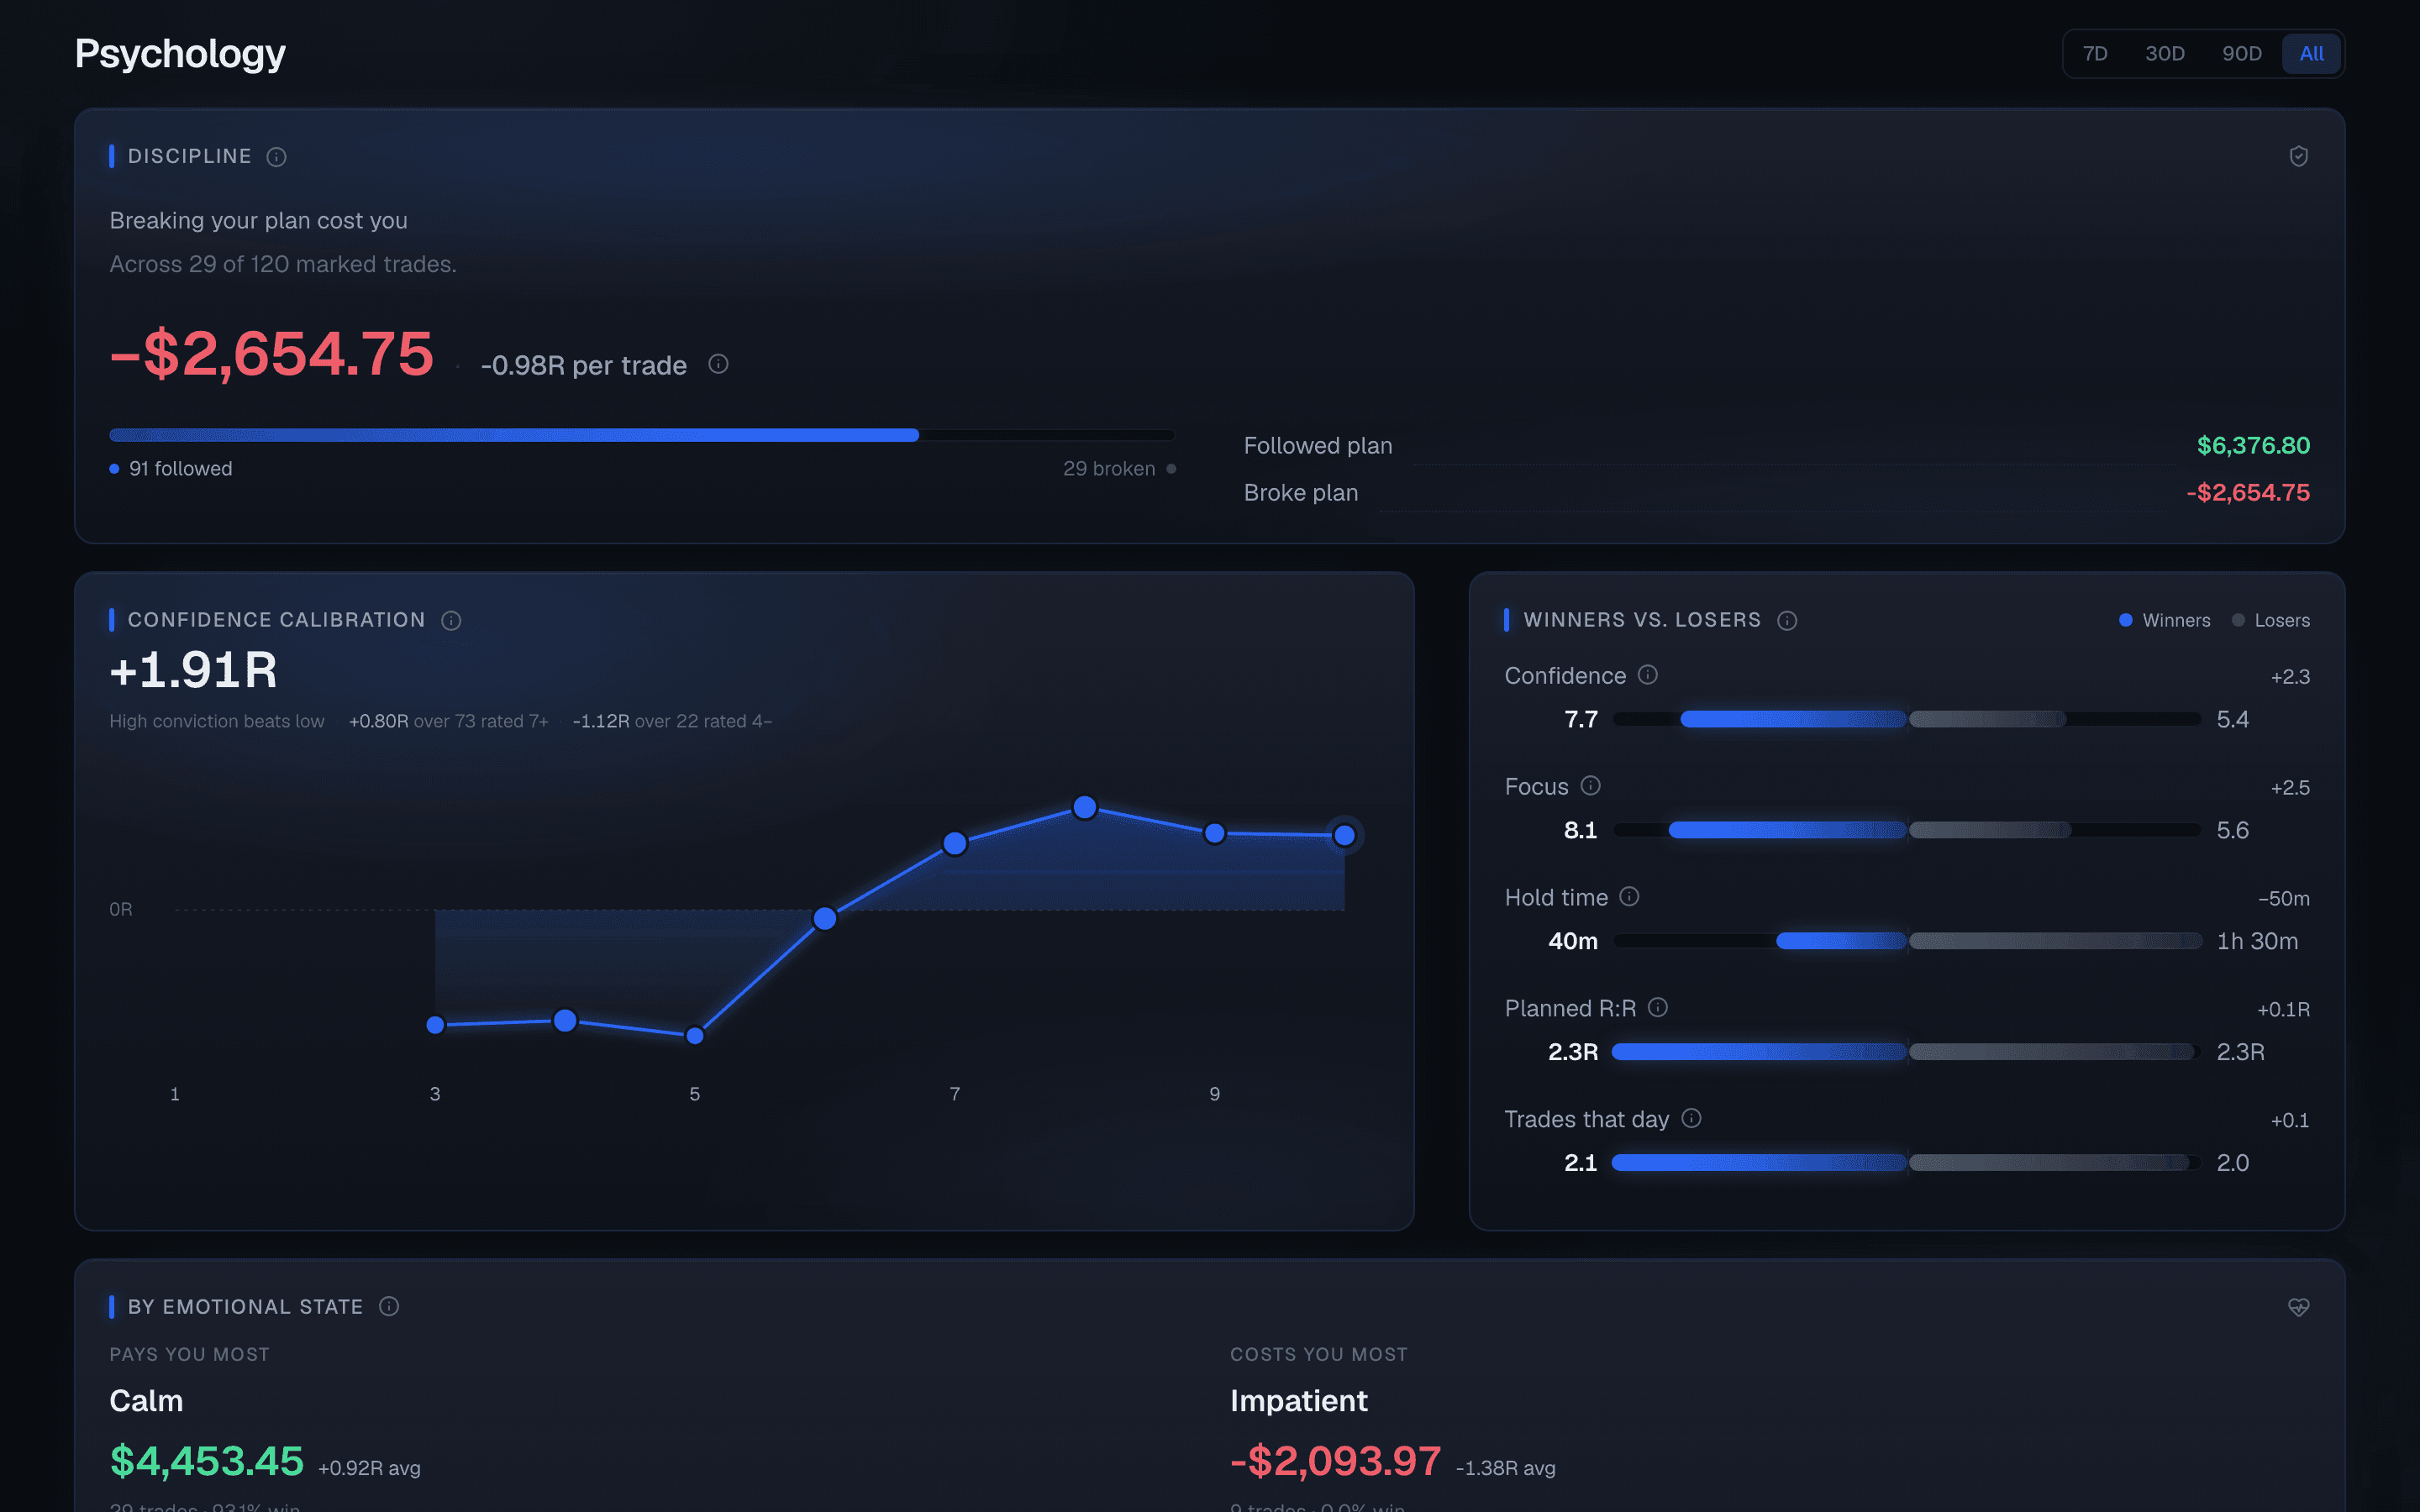
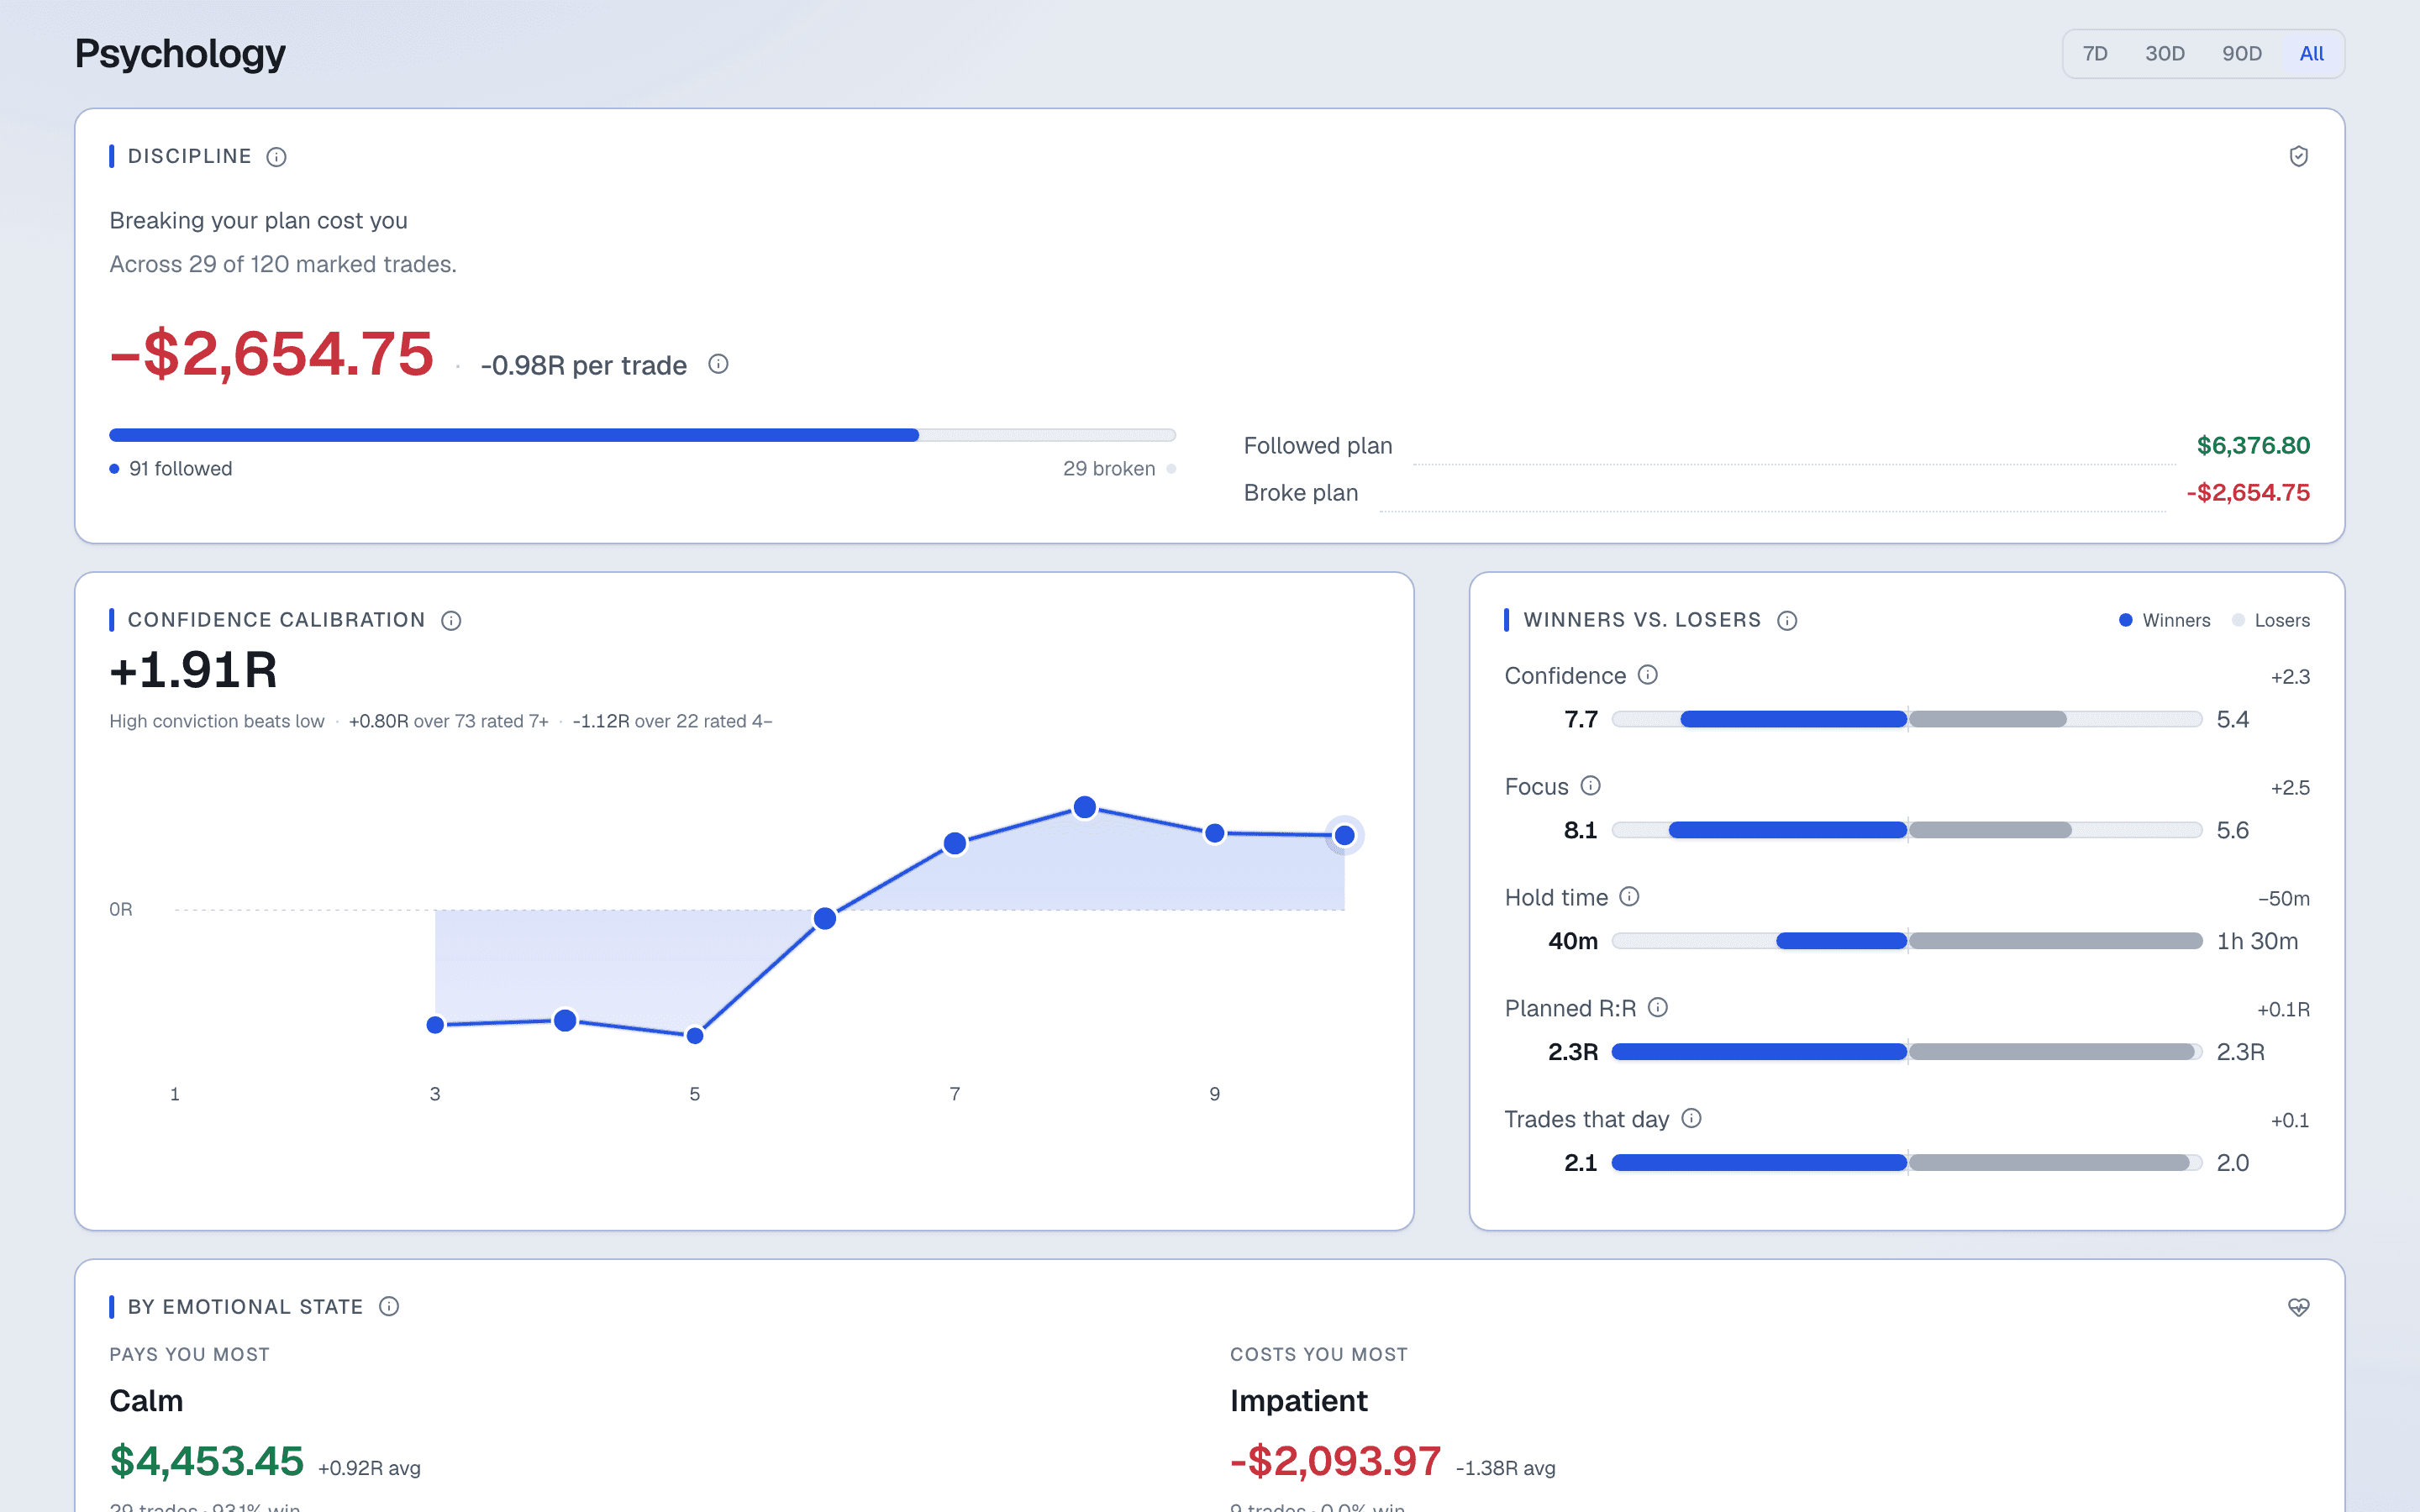
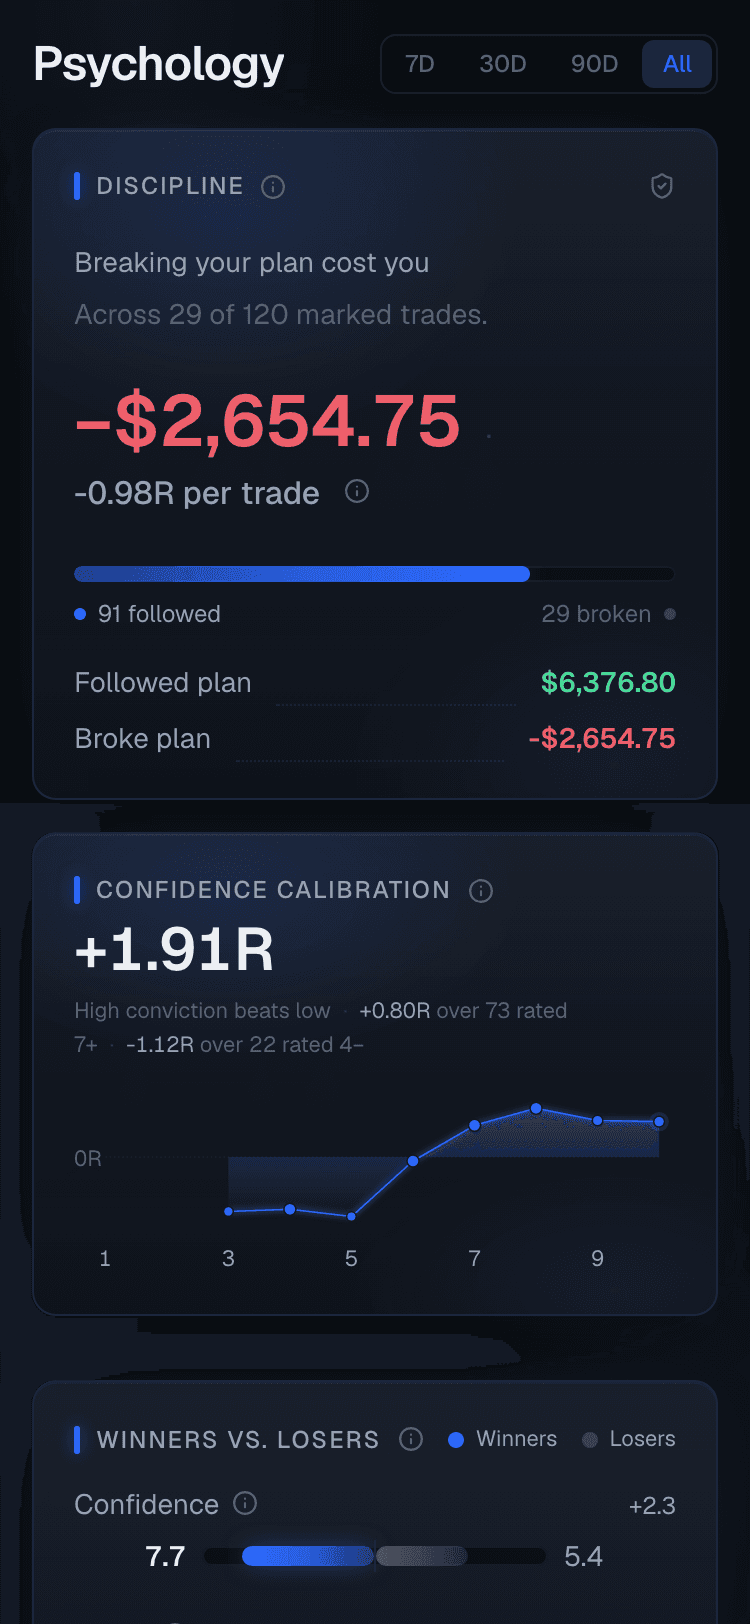
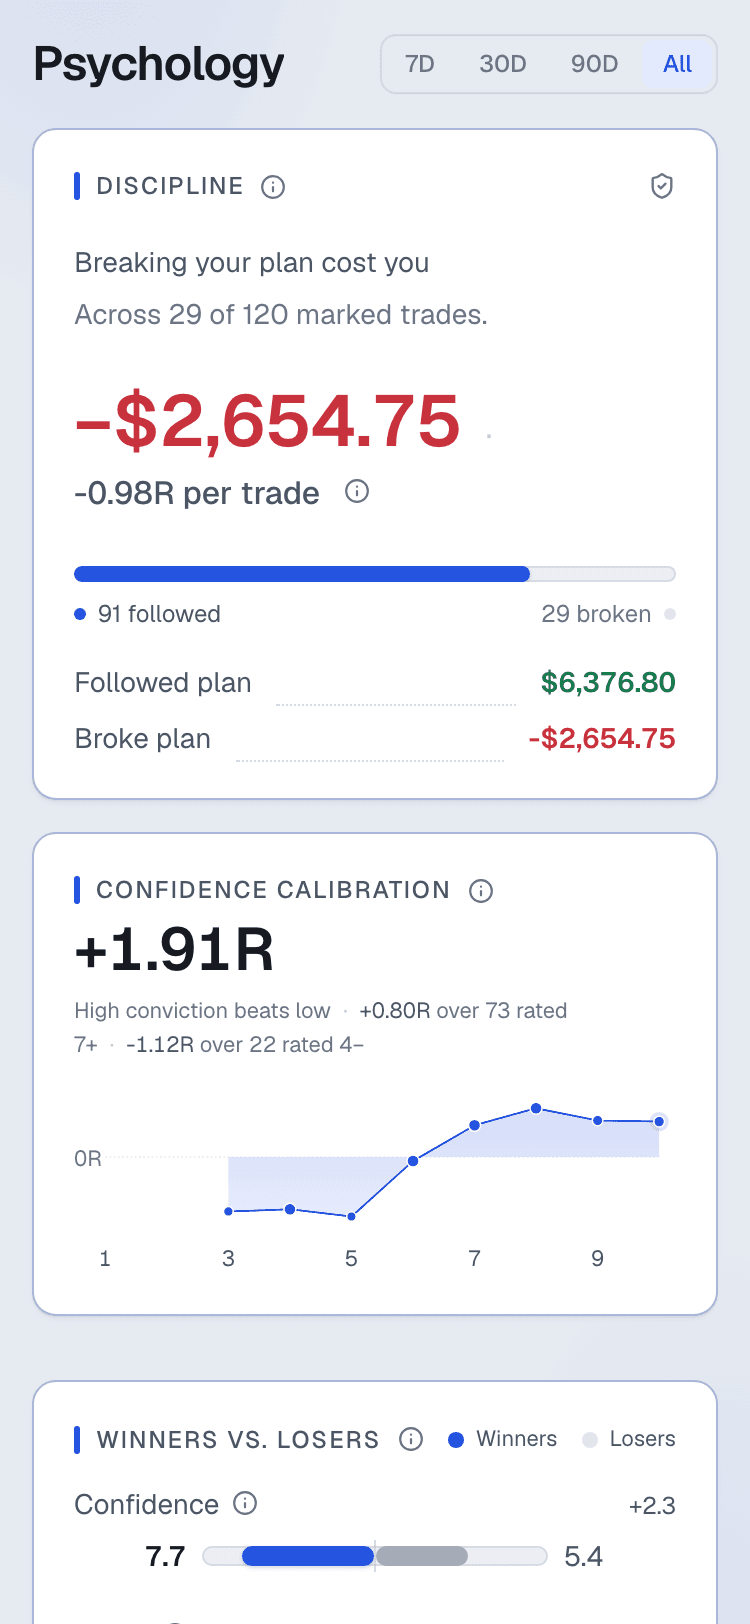
Psychology plots a calibration curve and coverage meter against your own trade history, evidence-gated throughout. It only speaks once there's enough data to say something true.
One score for discipline, not P&L
The Quil Score distills real trading behaviour into a single number on your dashboard. It's a mirror on consistency, never a shortcut to returns.
Close the loop, not just log it
Weekly and monthly reflections carry your last focus forward automatically, so the thing you told yourself to work on doesn't quietly get dropped.
Inside the app
Every core surface, built around real trading behaviour rather than just raw numbers.
Every screen below shows sample data from a generated demo account. The figures are illustrative, they are not anyone’s results, and nothing here is a claim about what you would make.
Trade logging
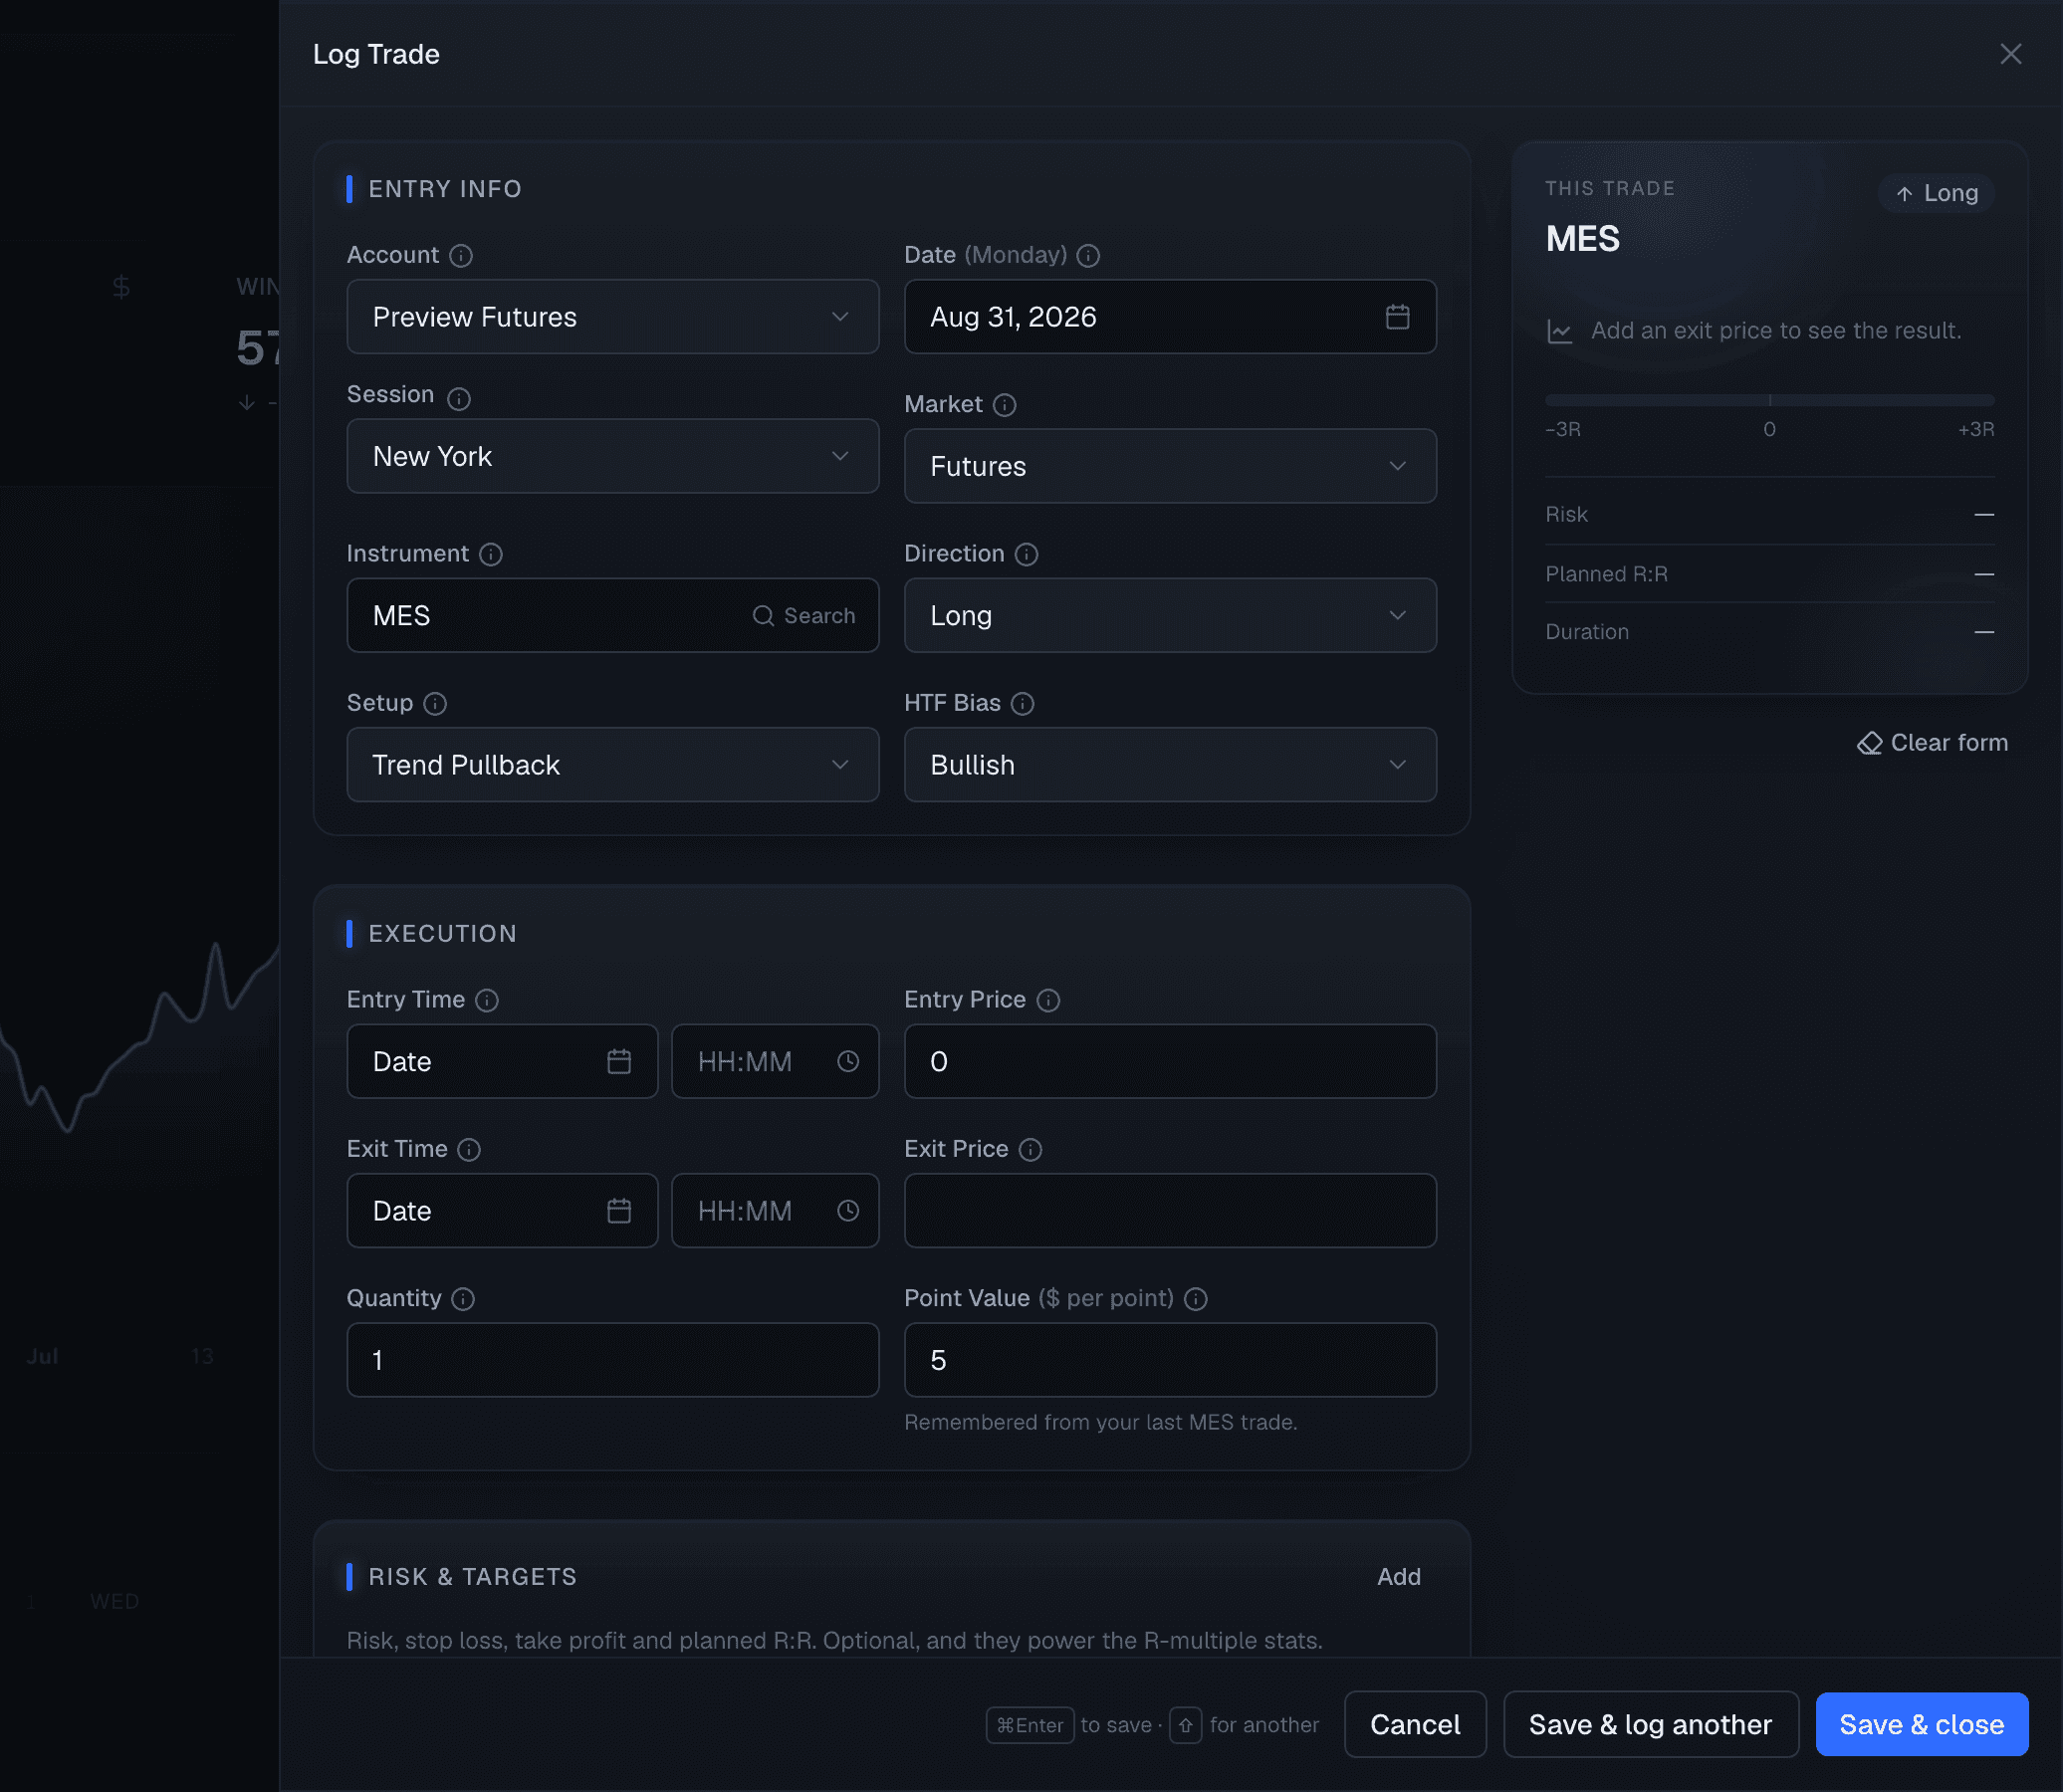
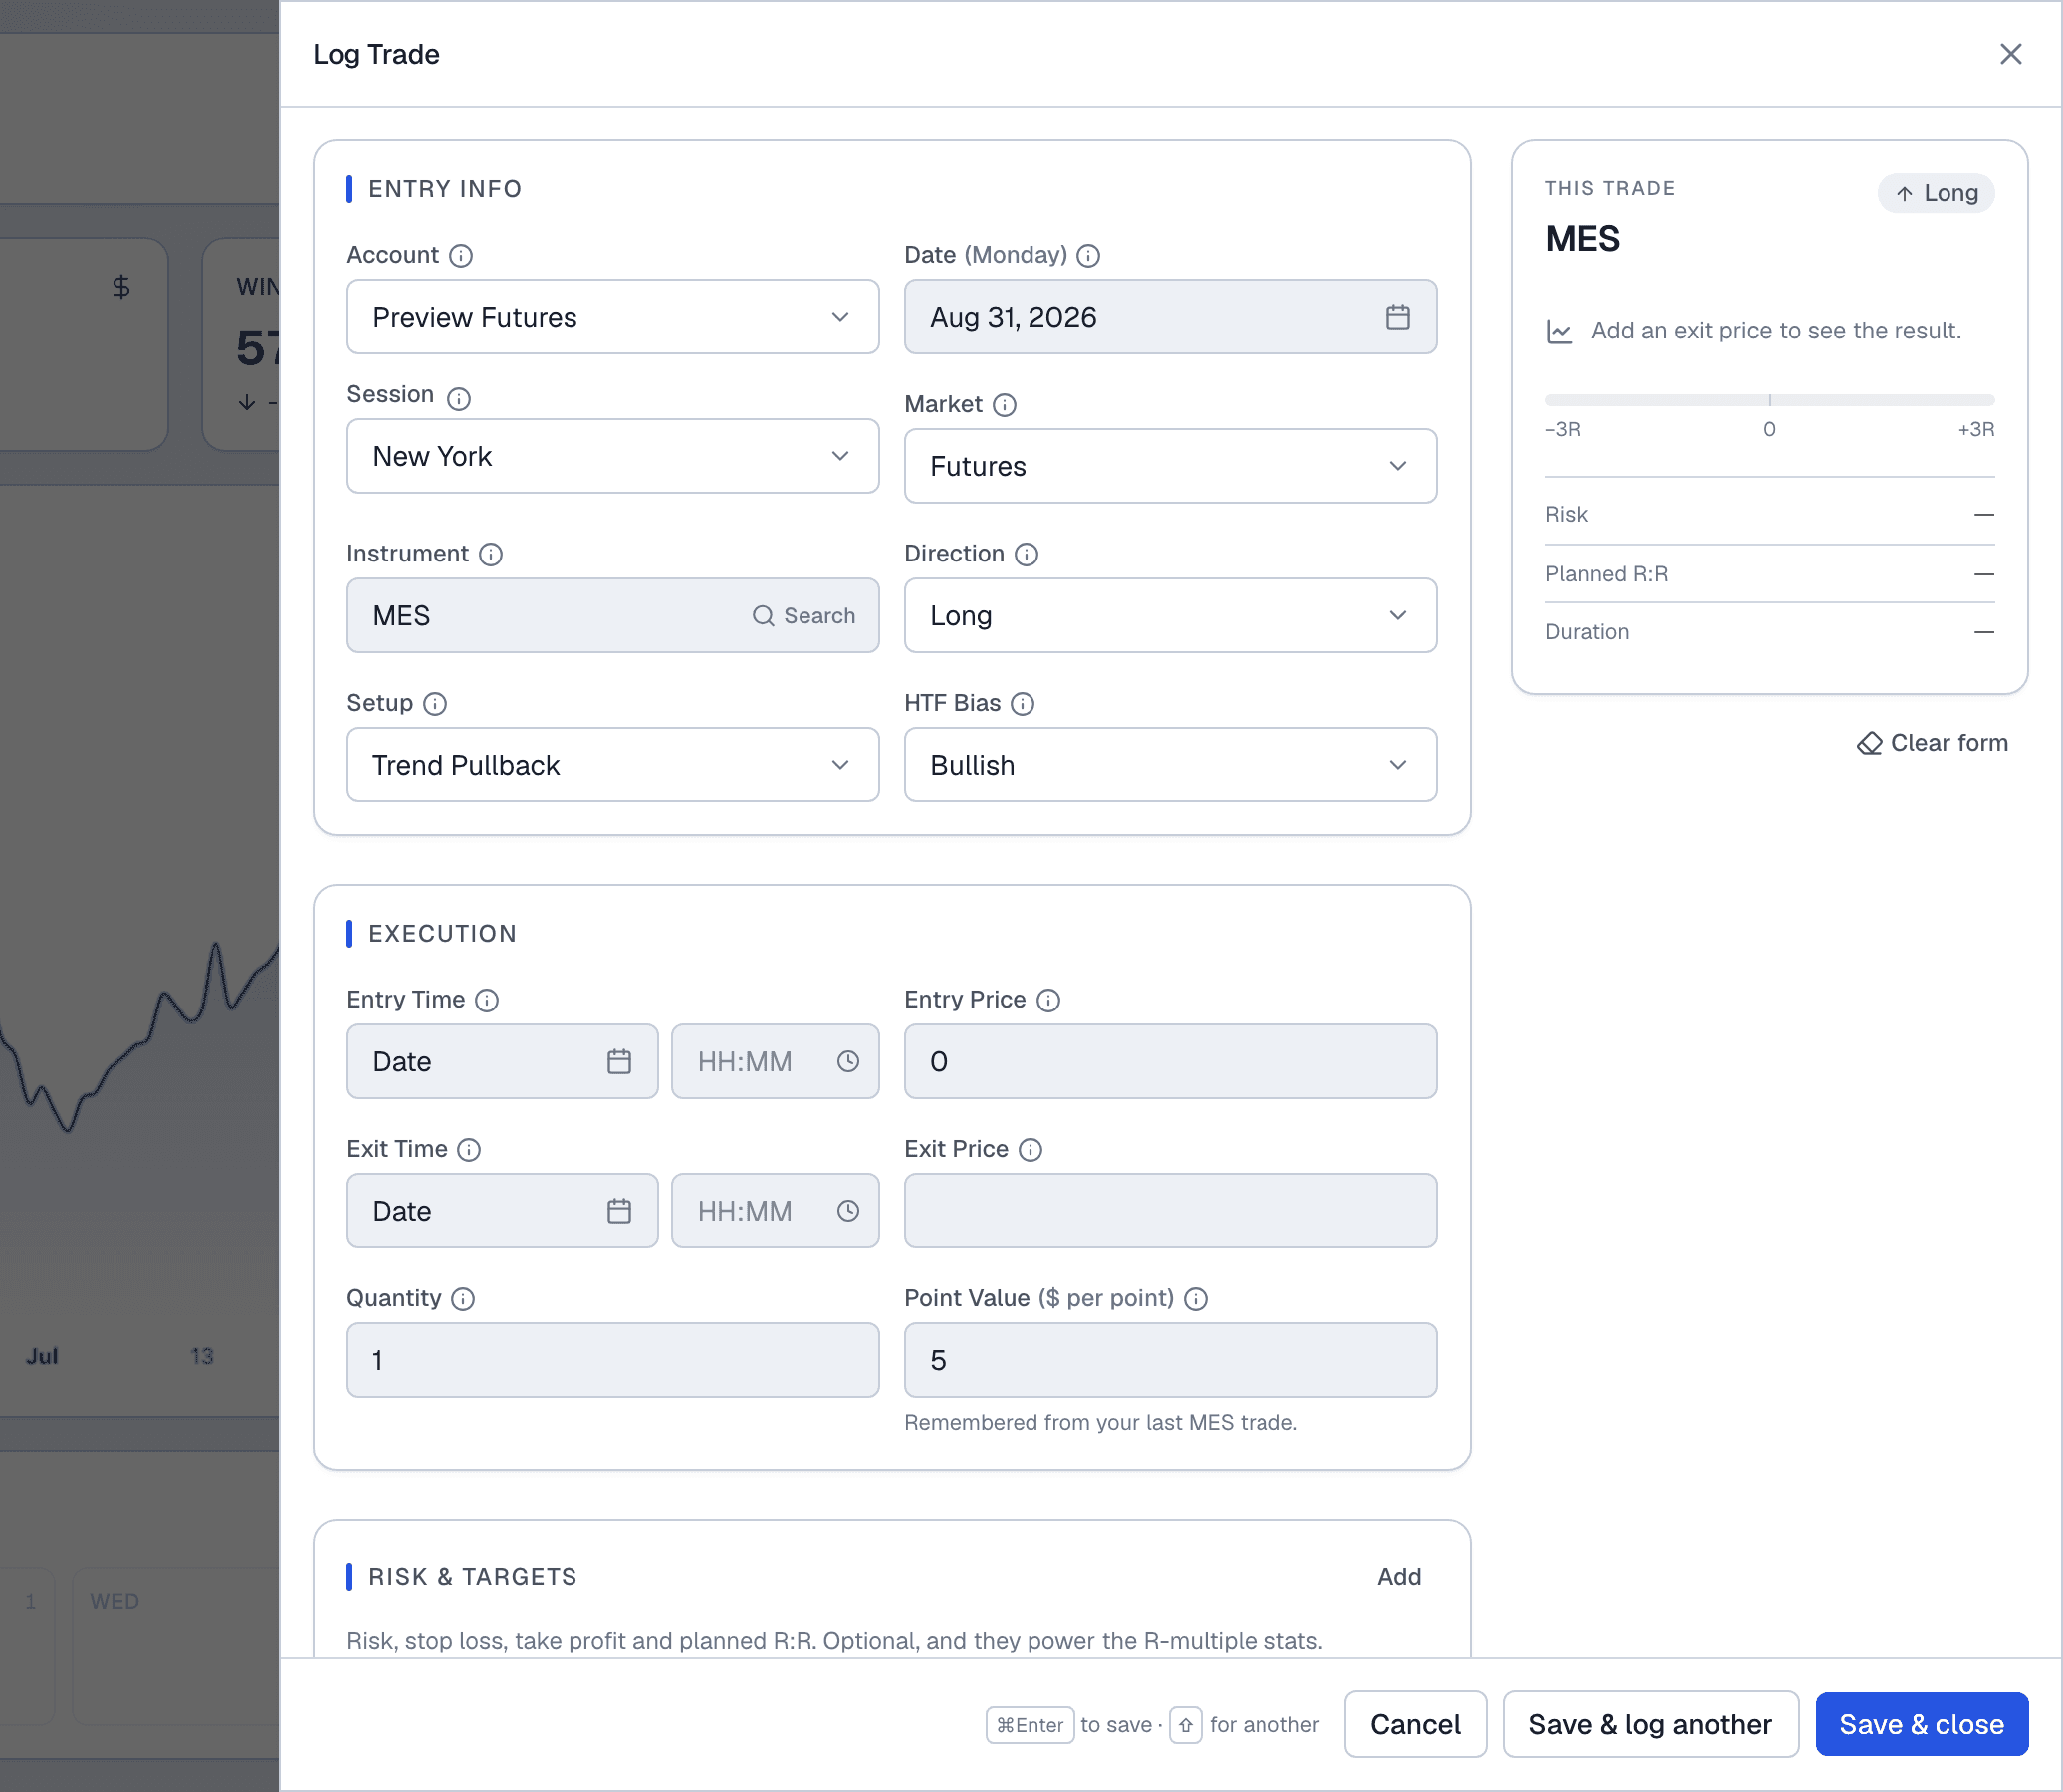
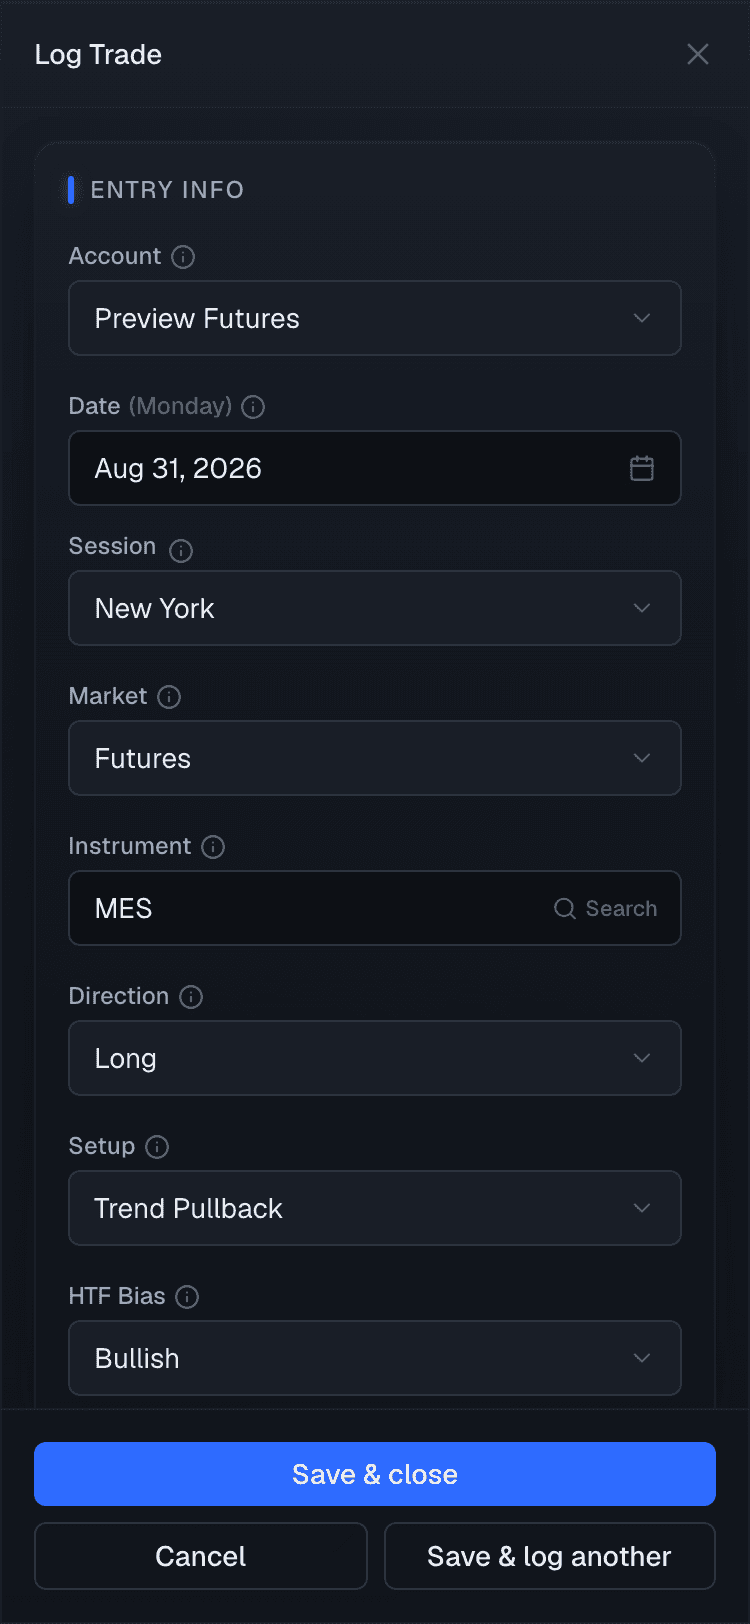
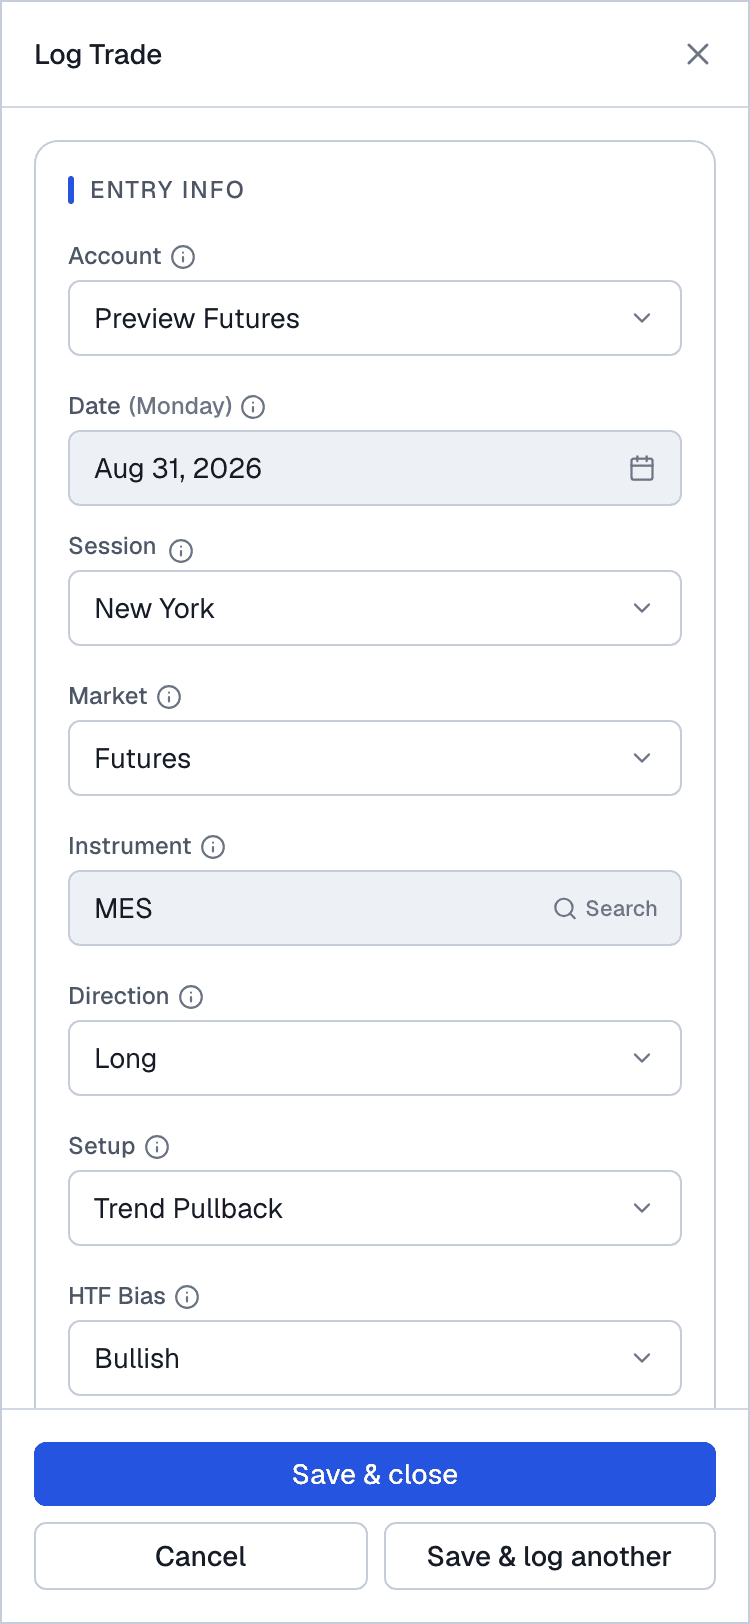
Log a trade in seconds
A slide-over, never a page navigation. The faster logging is, the less likely it gets skipped, and a journal only works if it's actually kept.
Dashboard
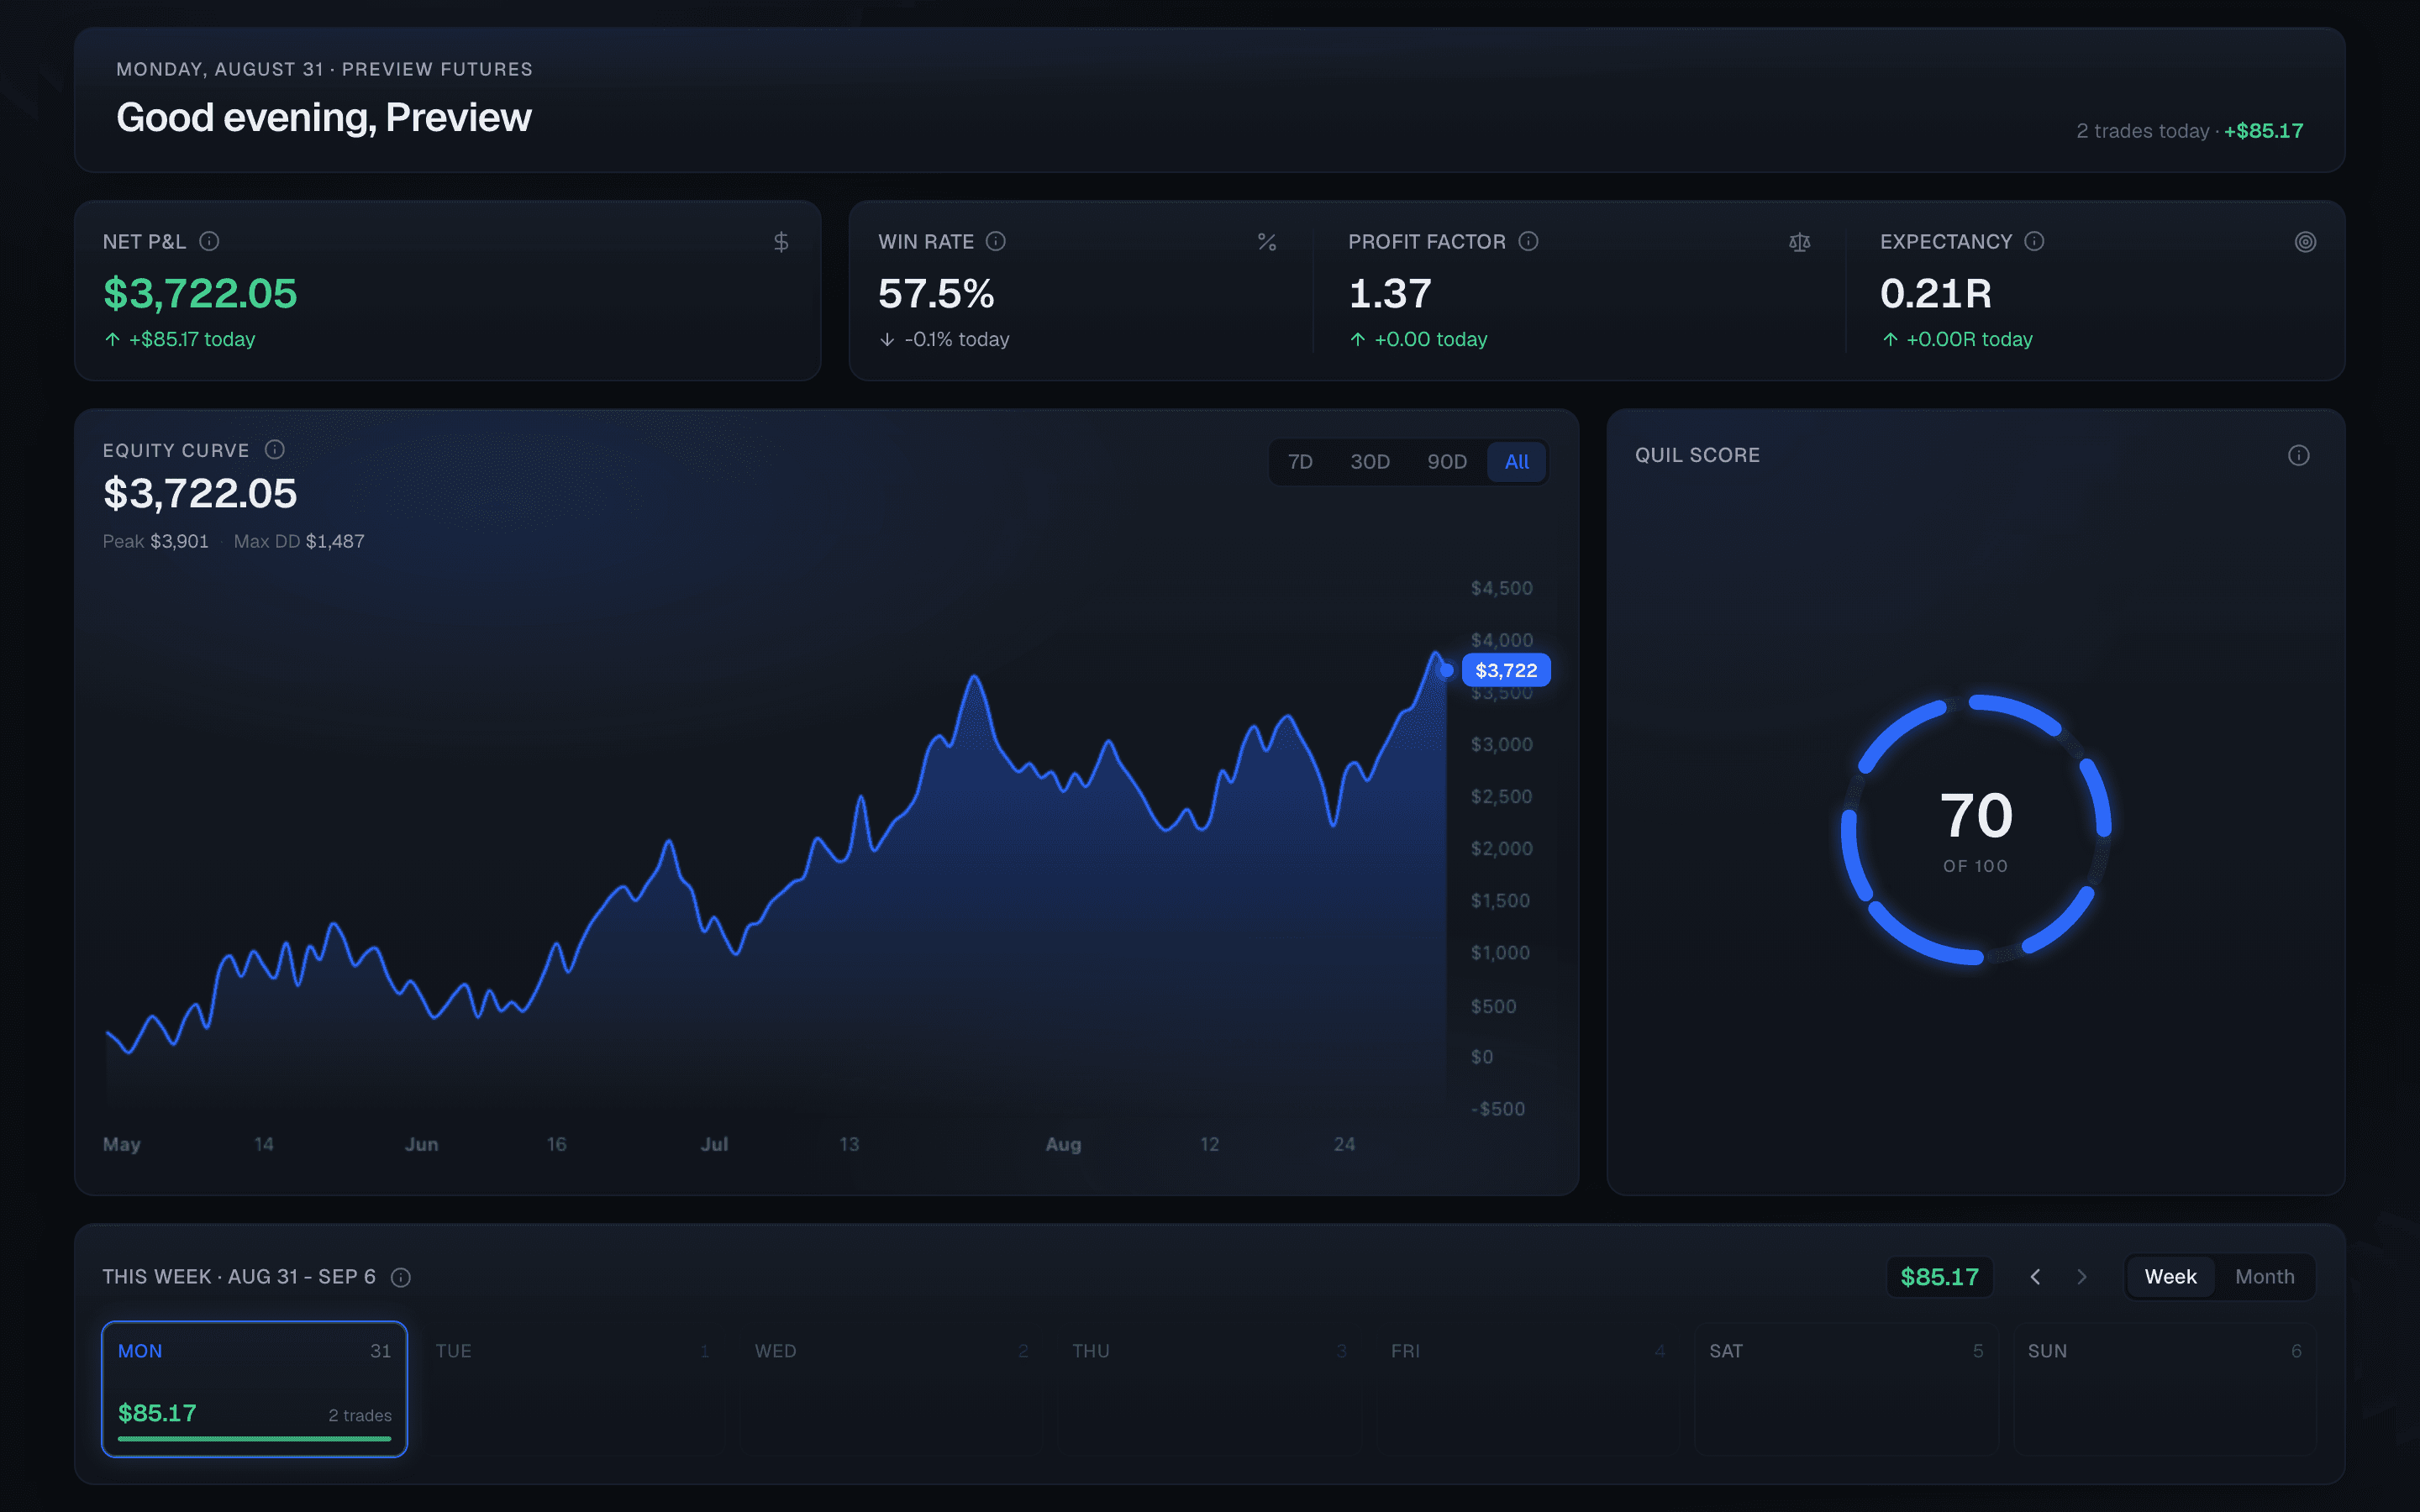
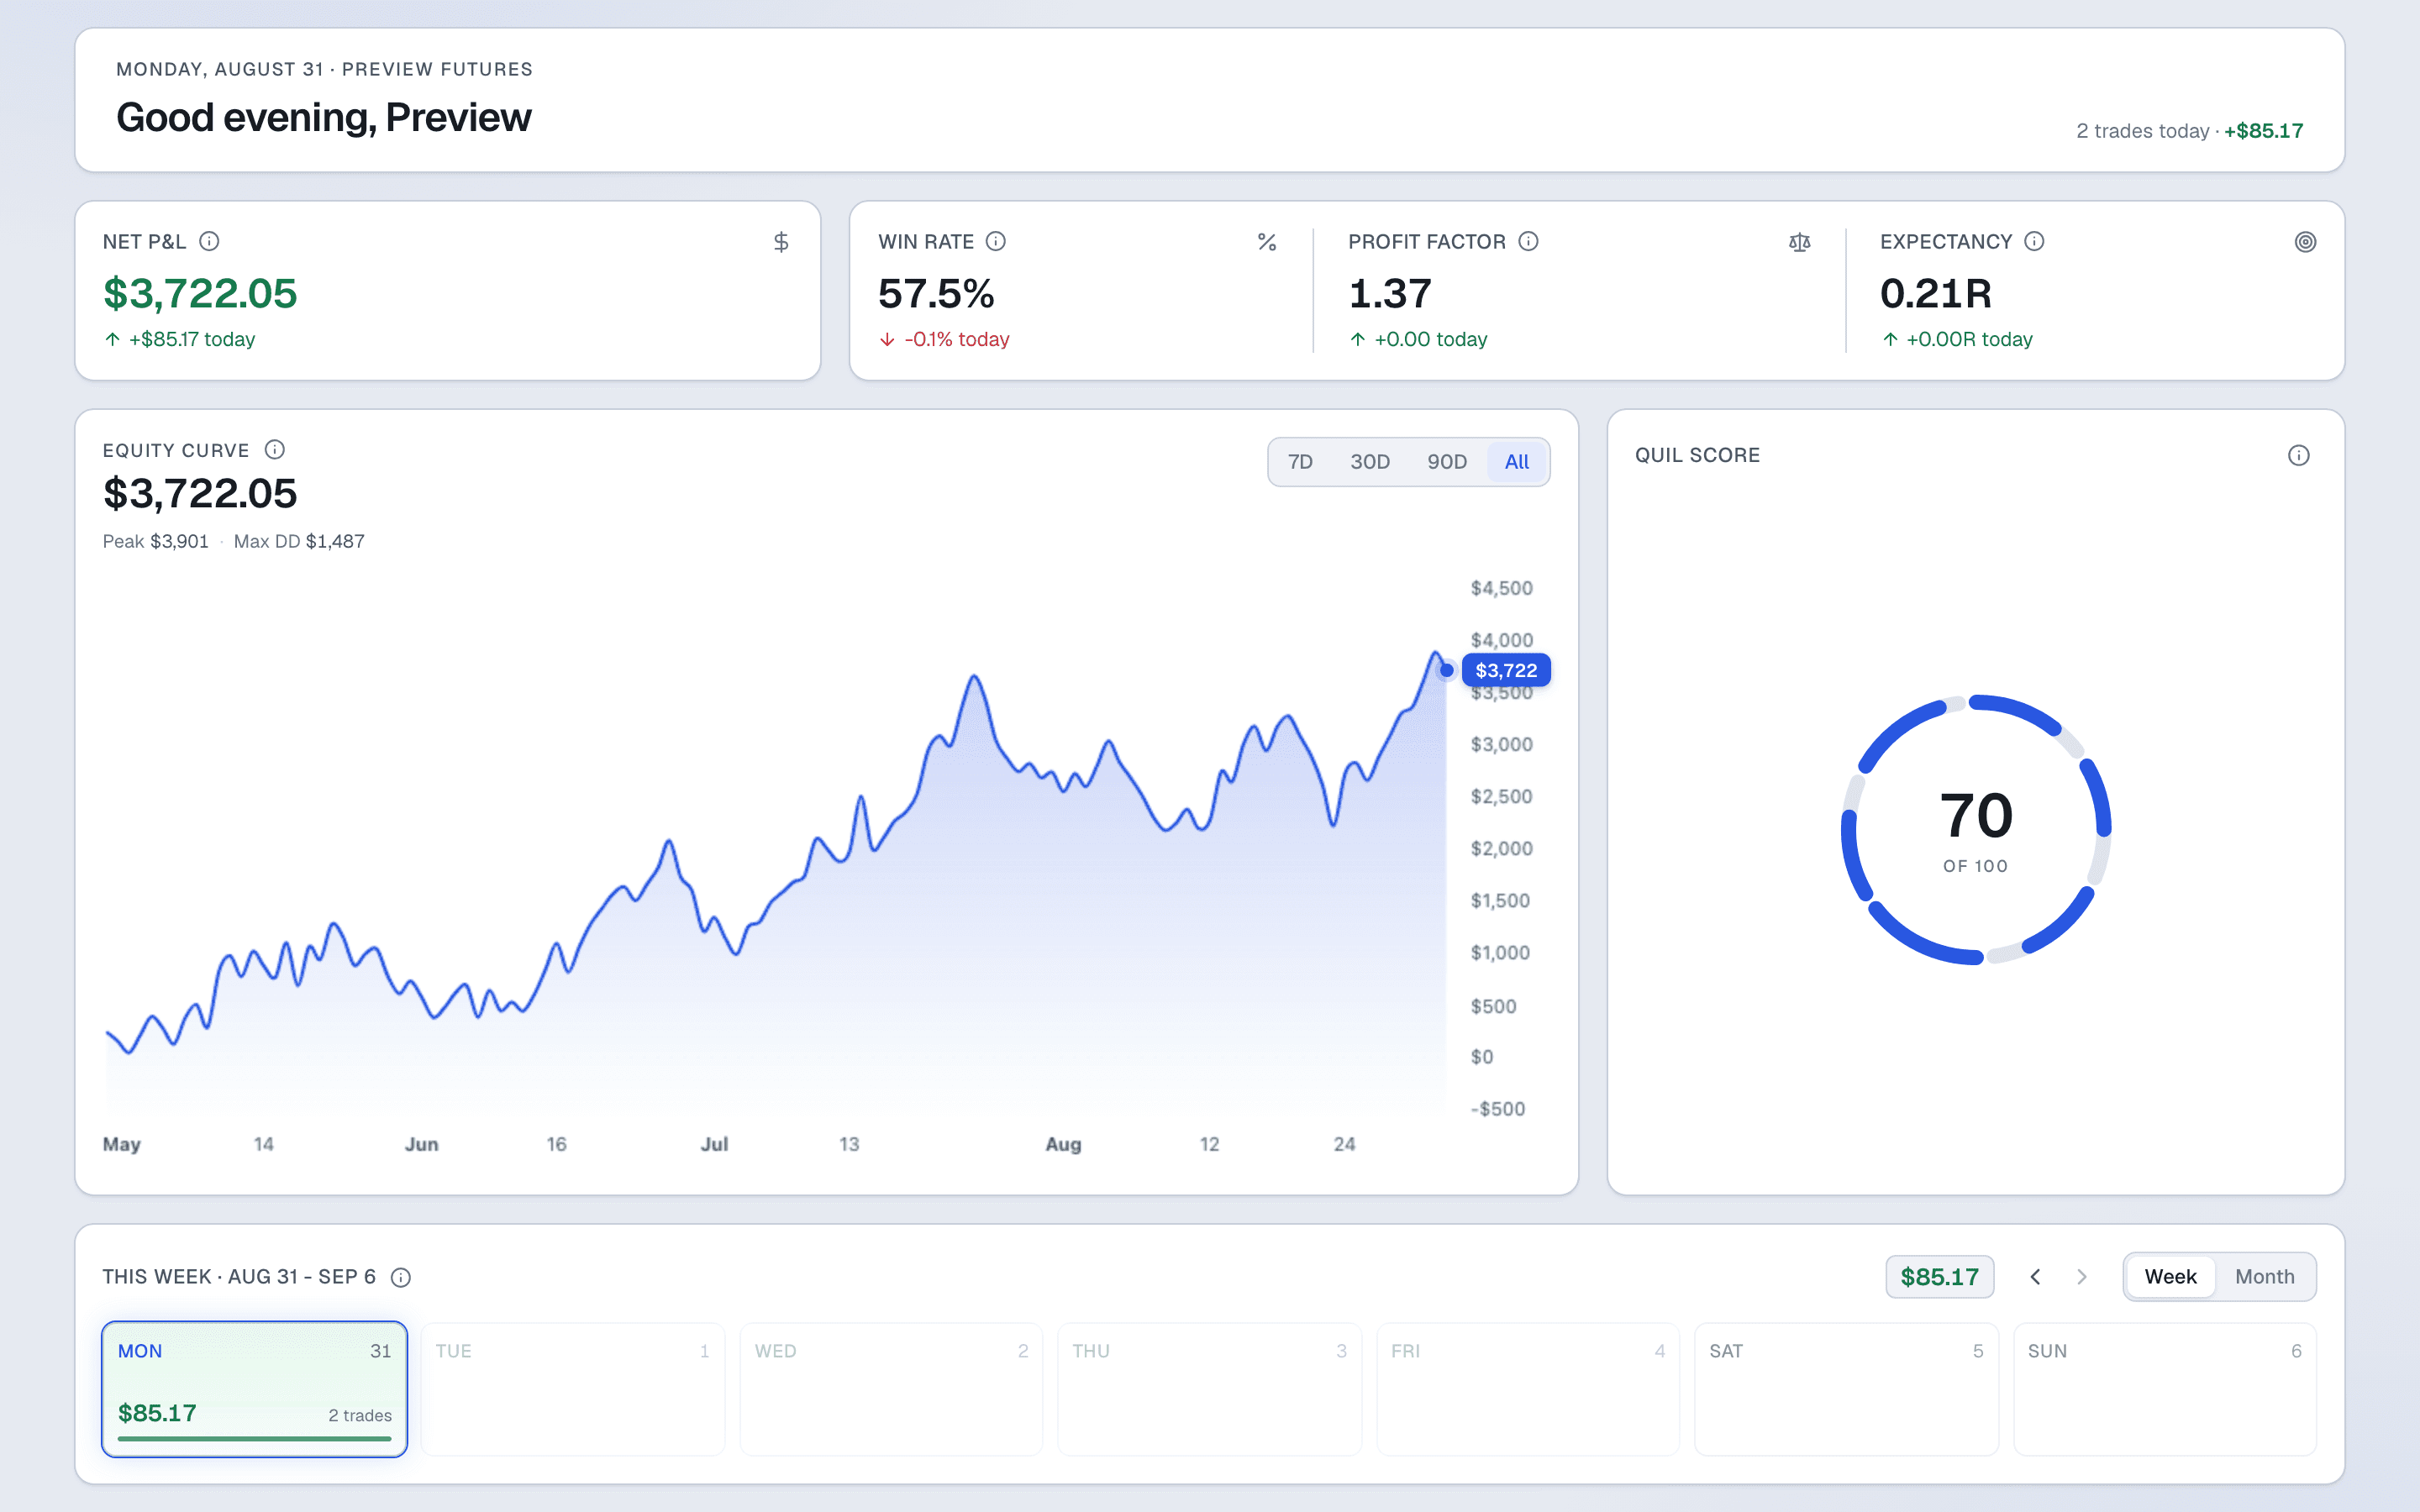
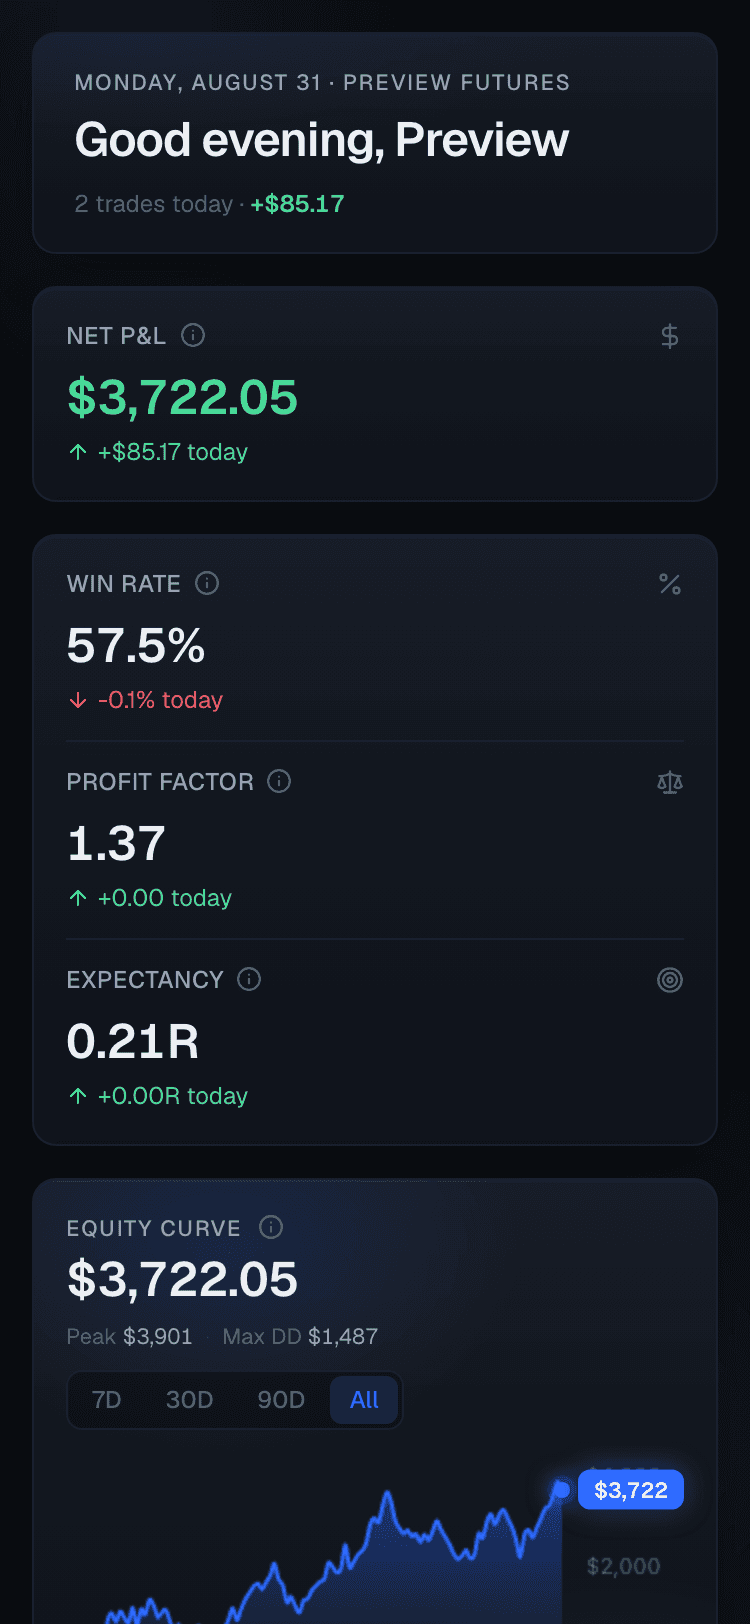
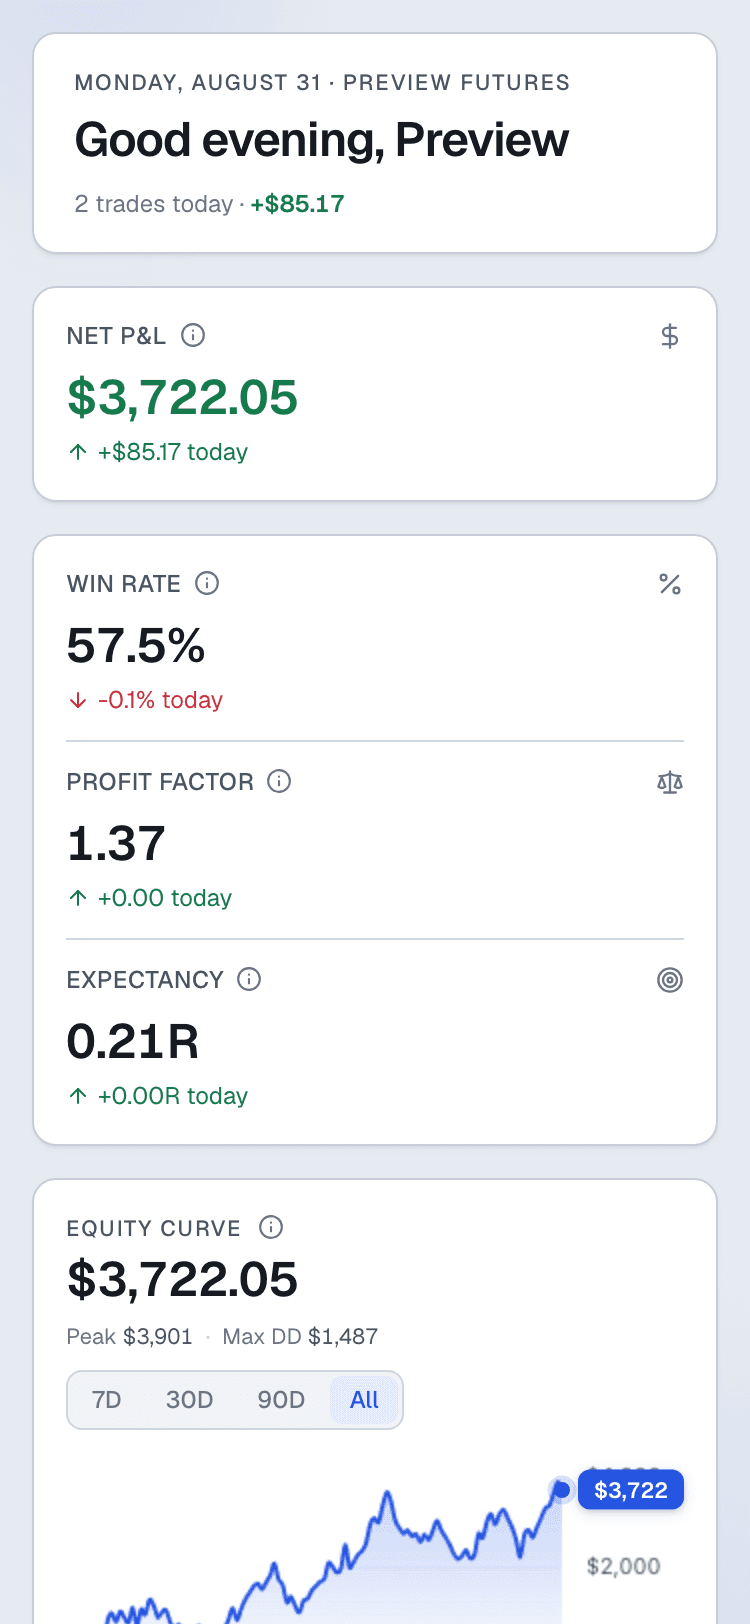
Your whole session, one screen
Equity curve, key stats, and your Quil Score together, so the first thing you see is the shape of your trading, not just the total.
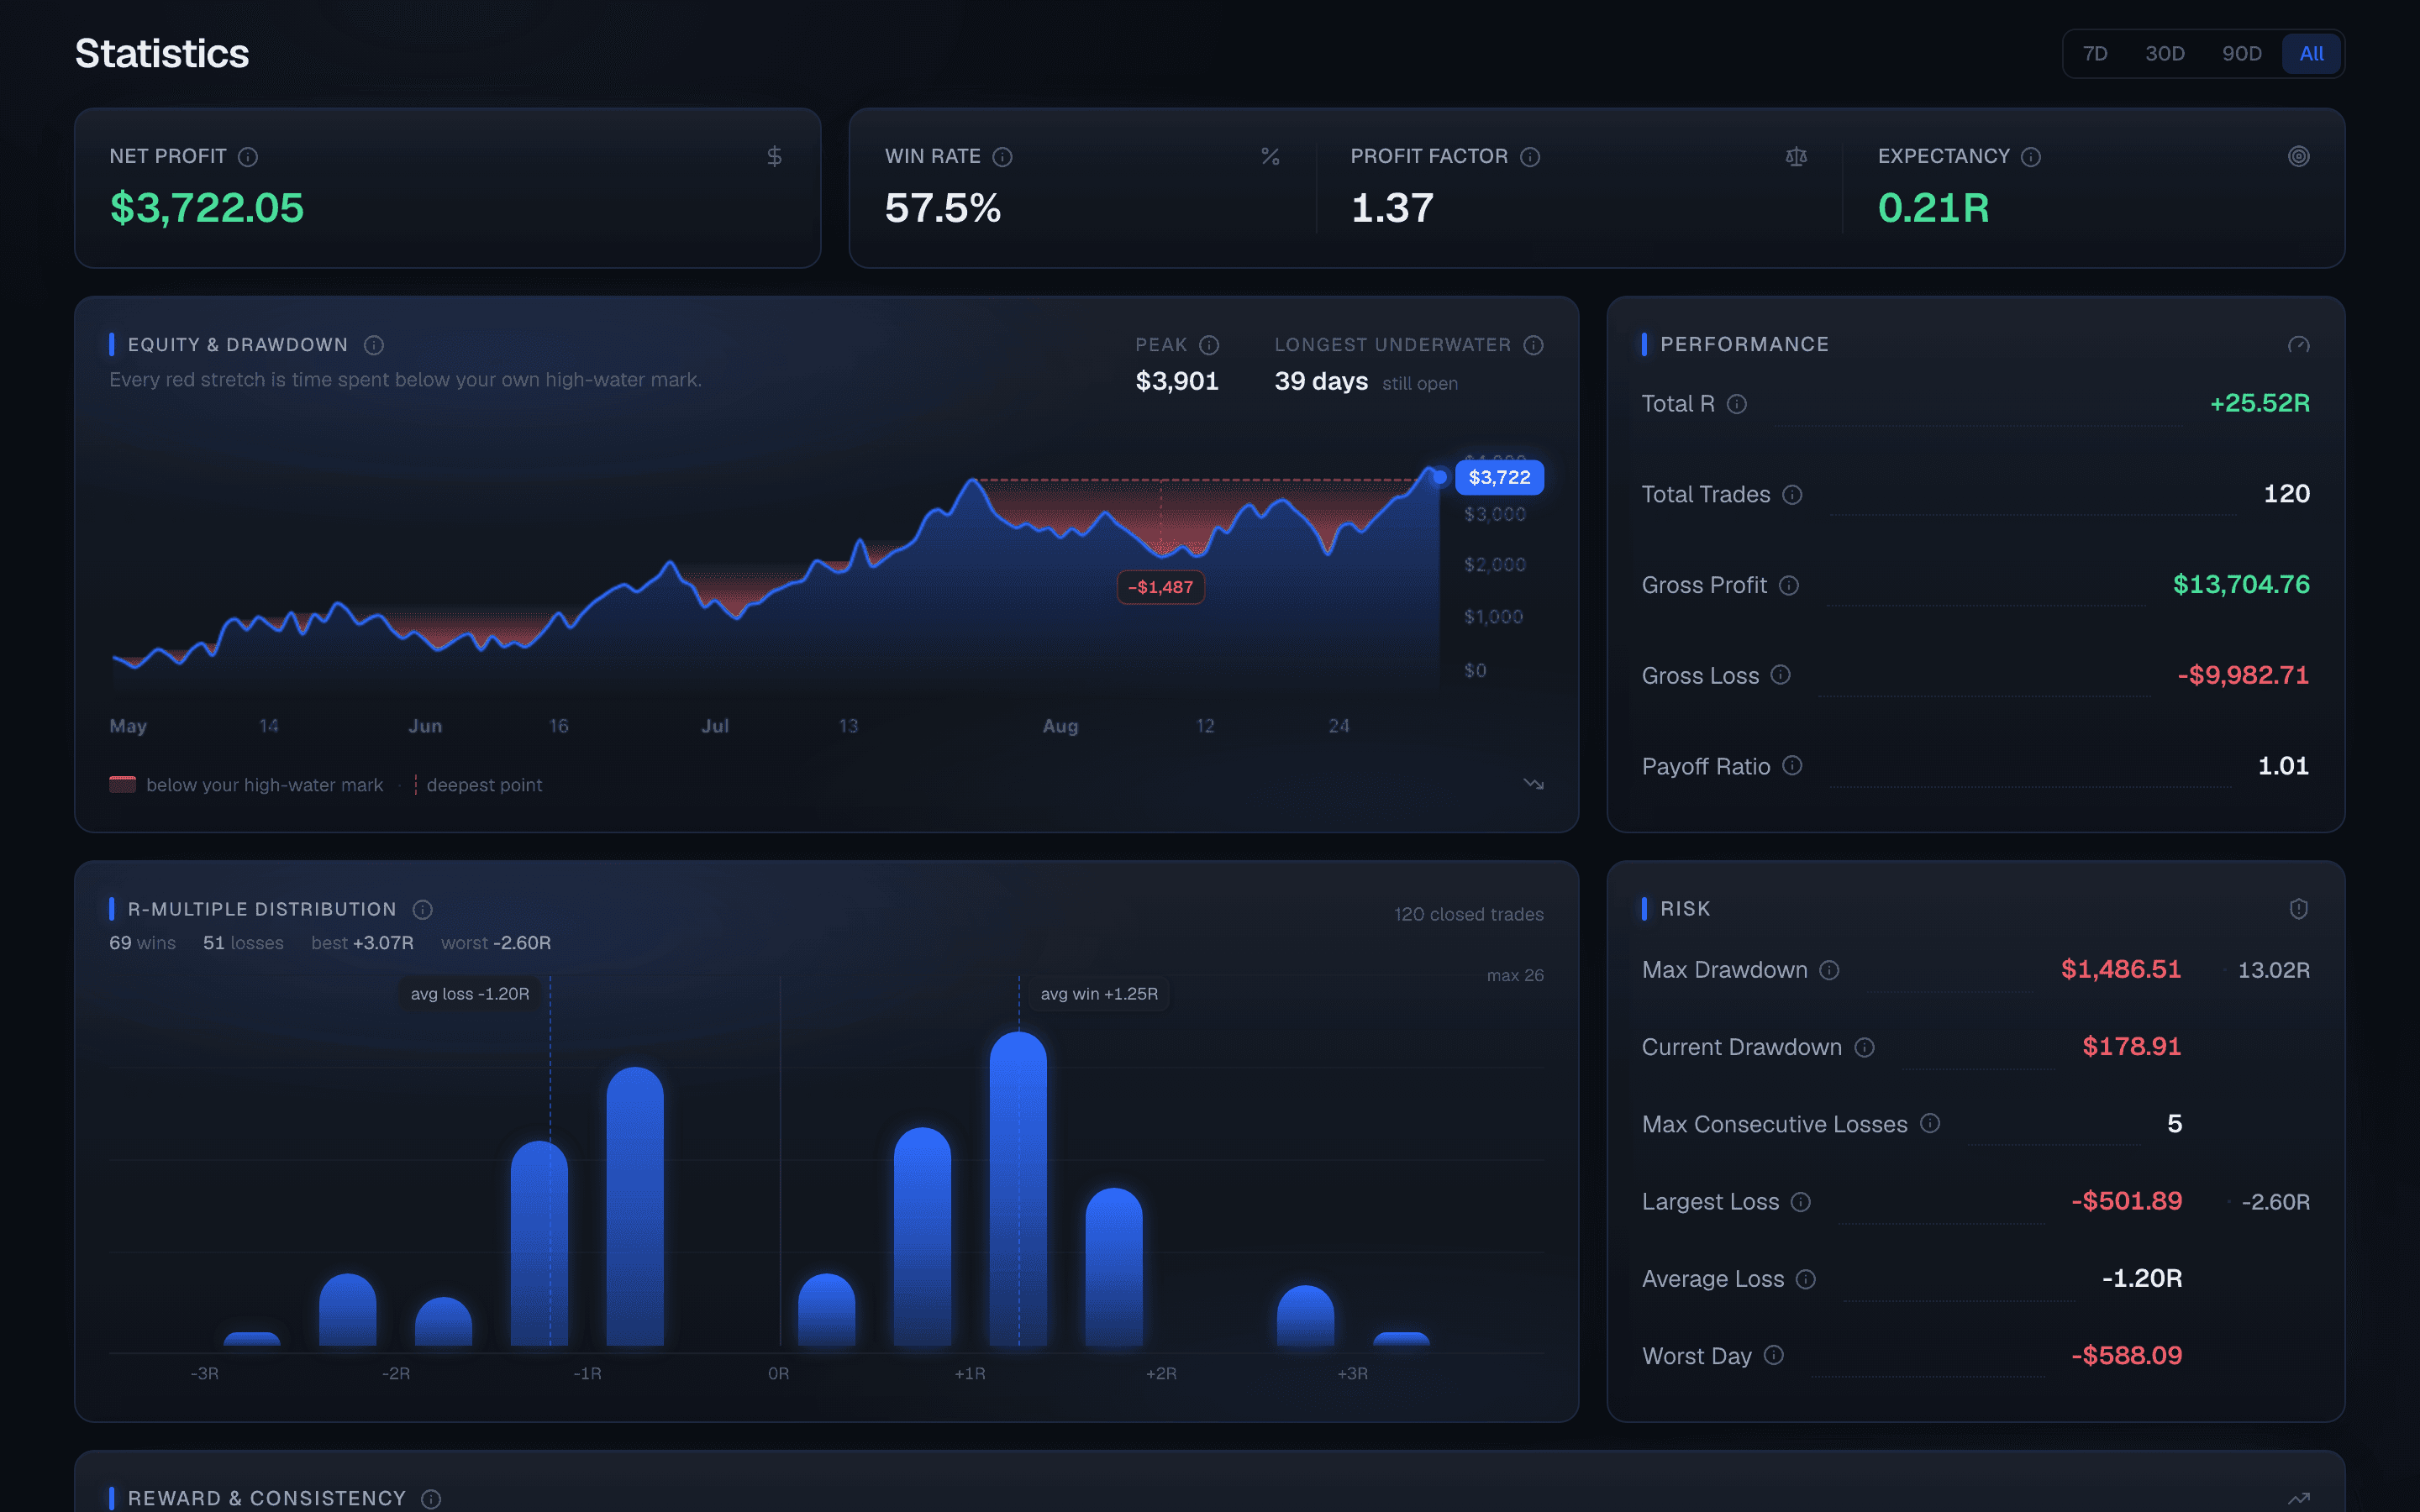
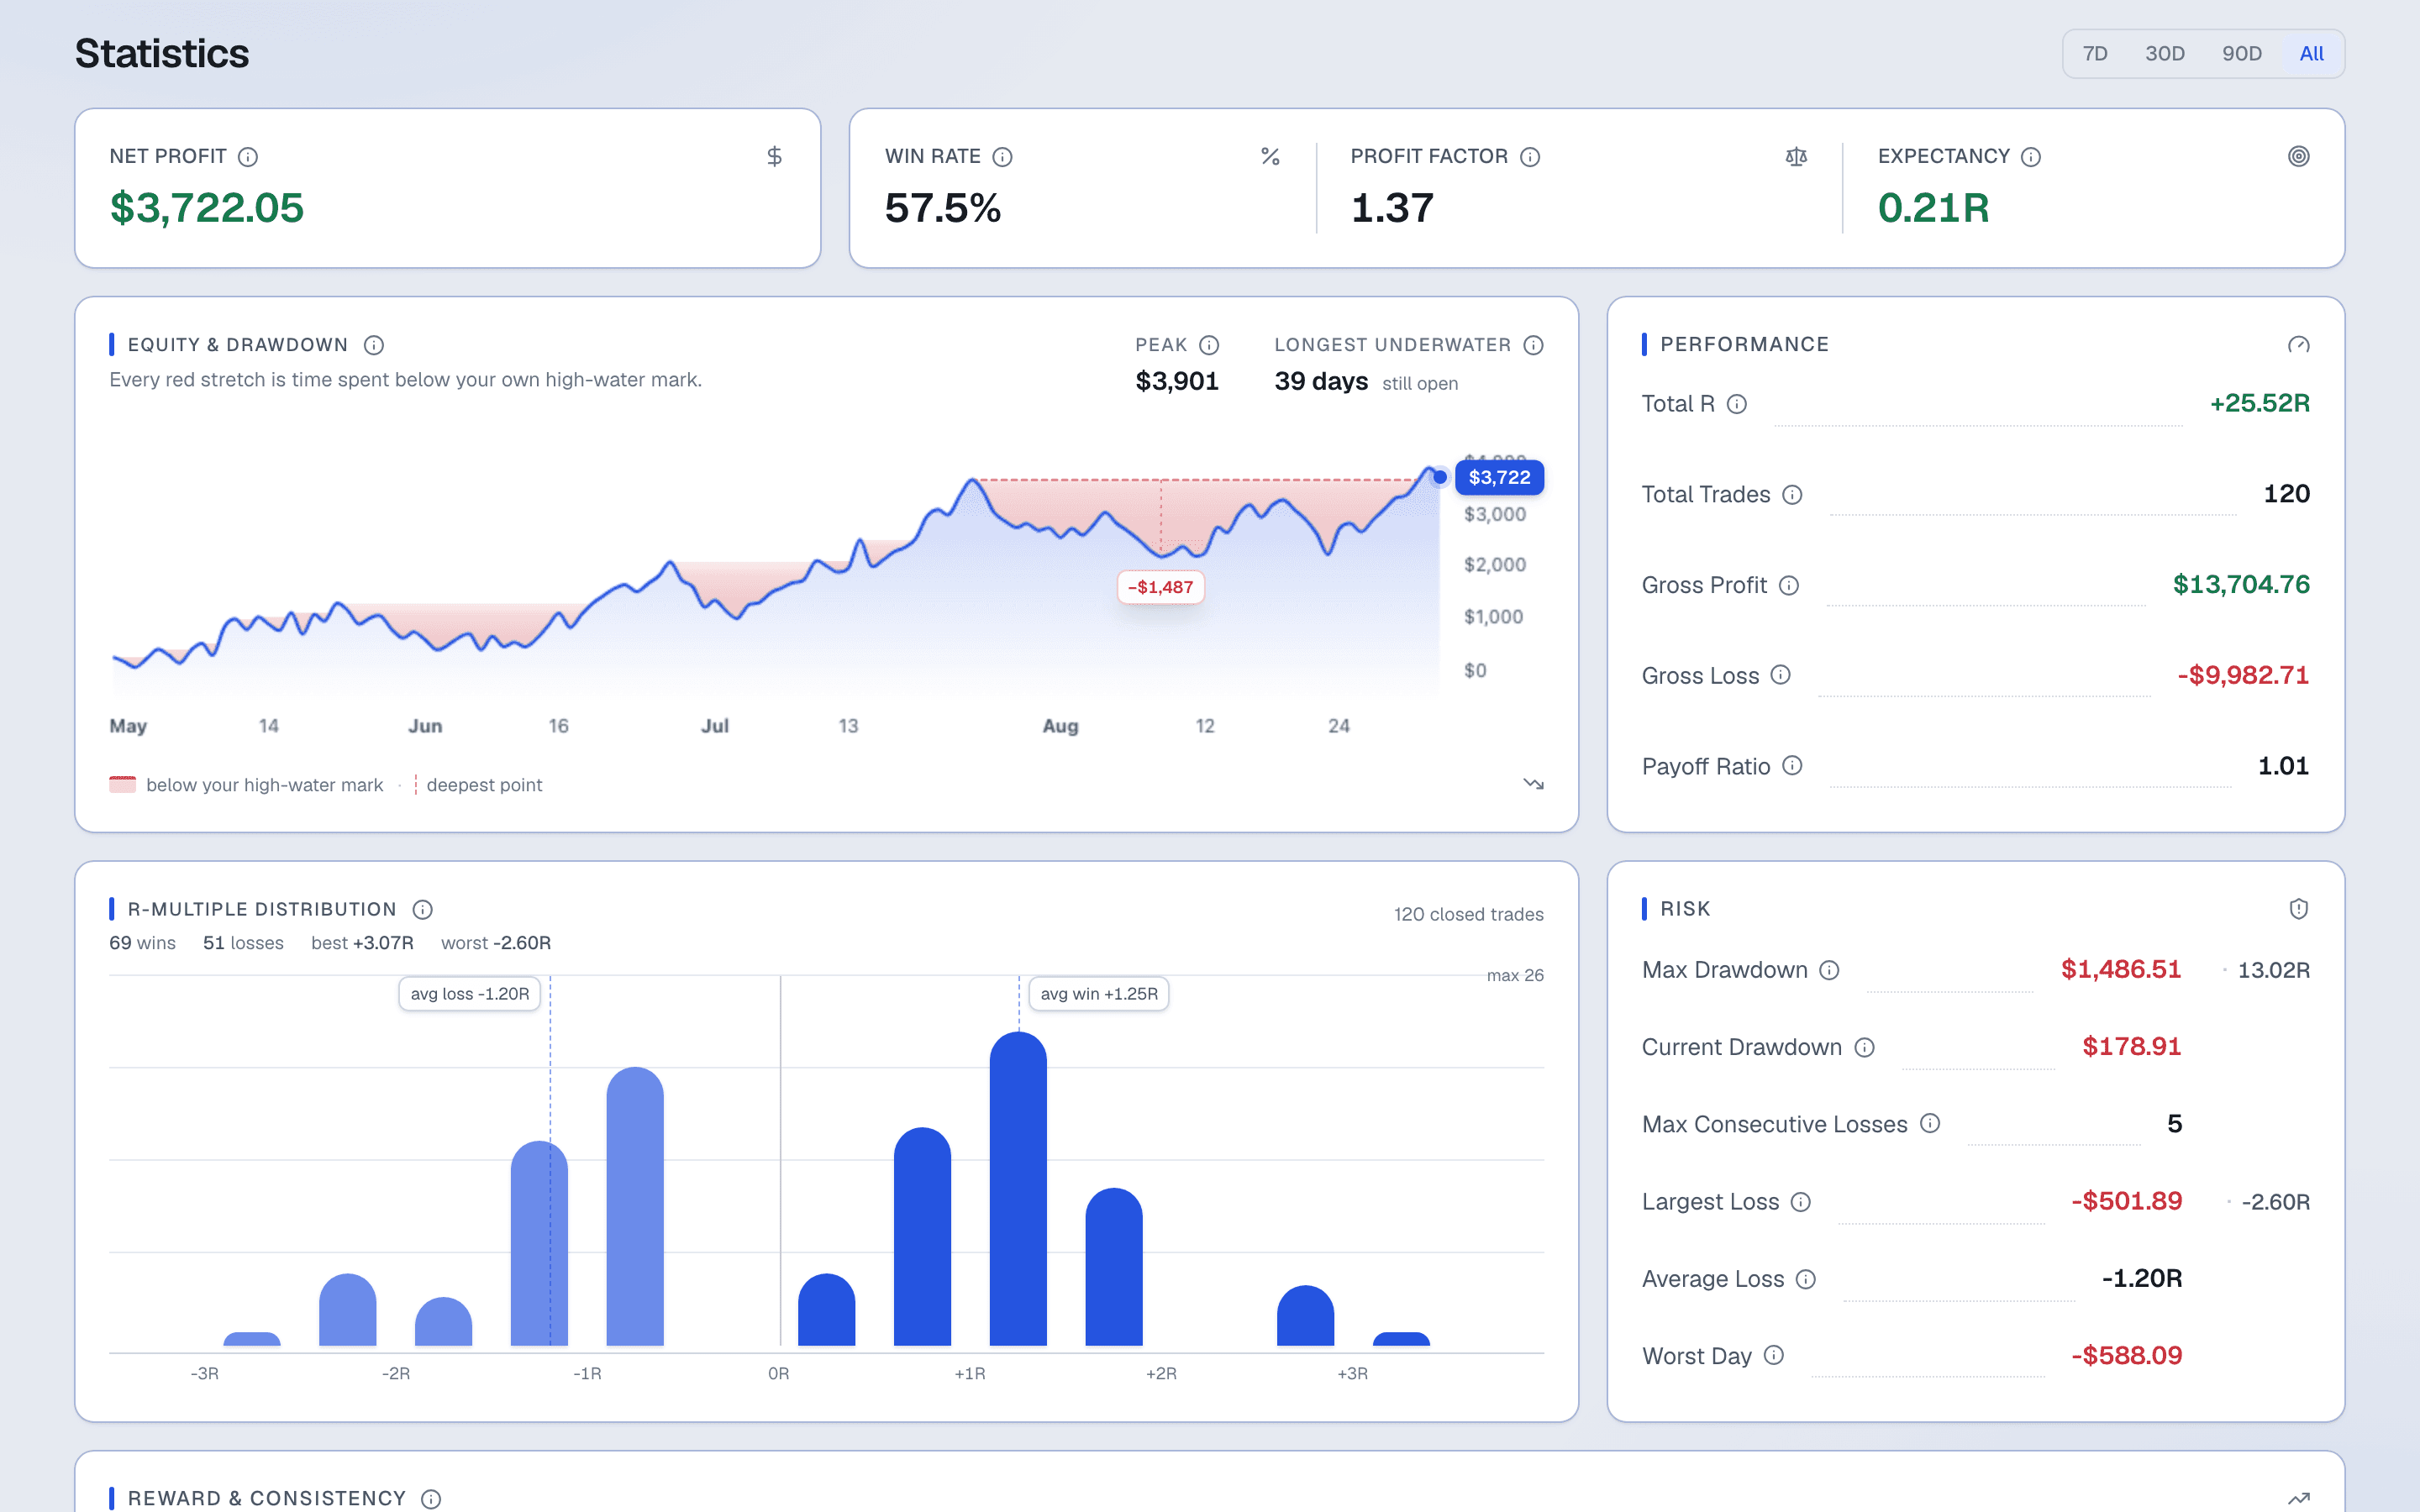
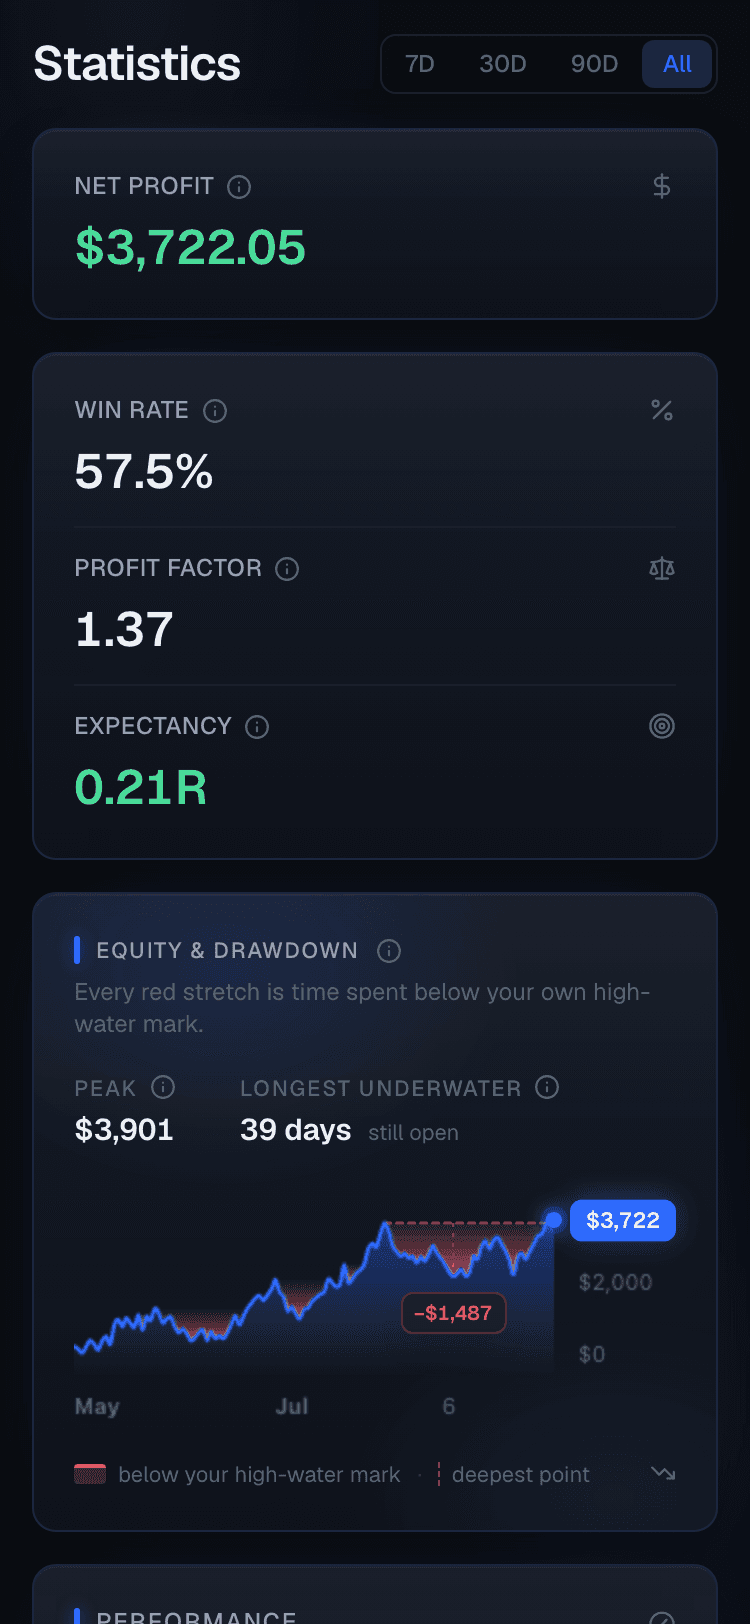
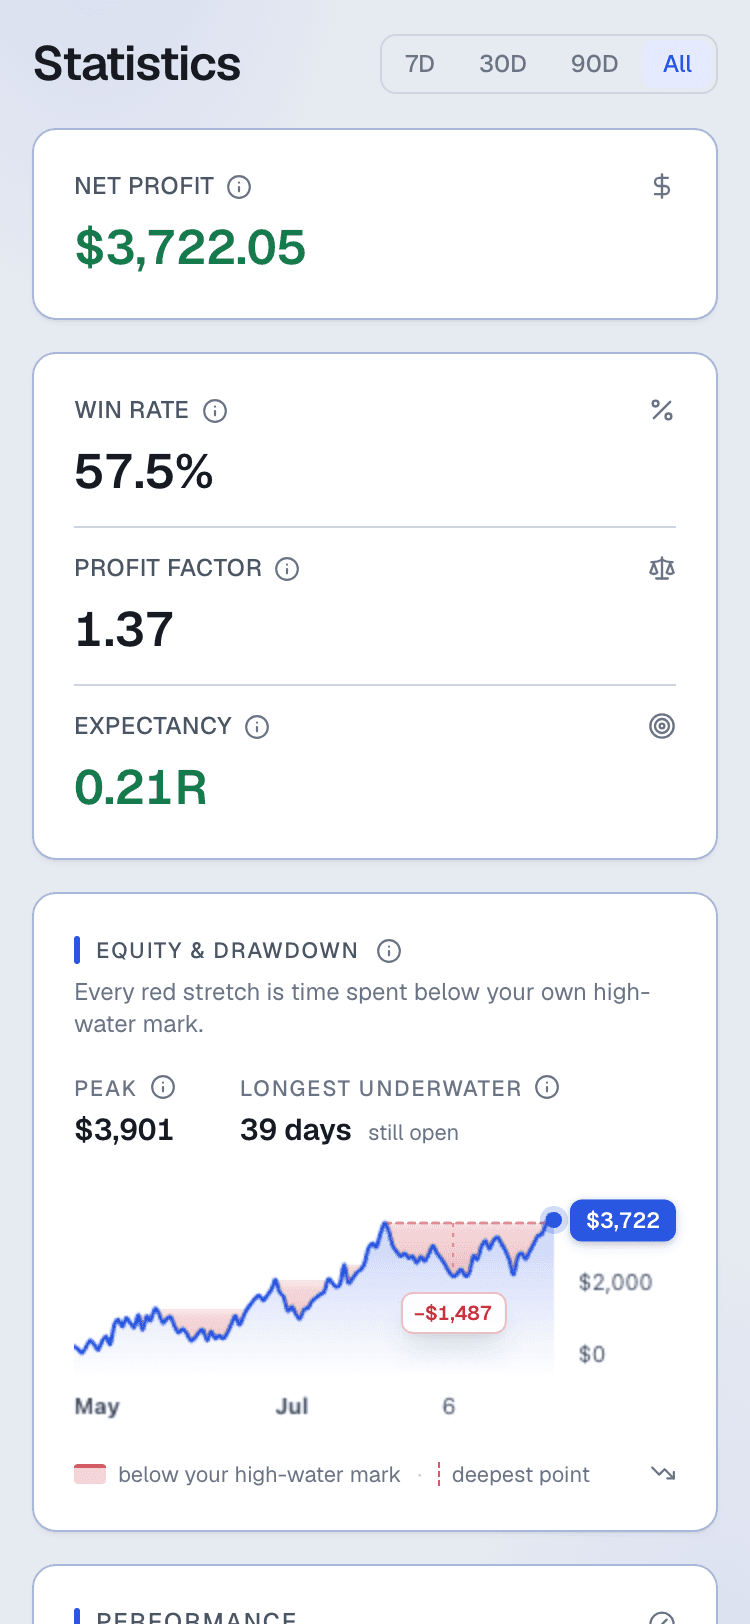
Statistics
Every number, evidence-based
Performance overview through risk metrics, R-distribution, and an hour-by-weekday heatmap: the deep view for when you want to know, not guess.
Psychology
Know if your confidence is earned
A calibration curve and coverage meter, evidence-gated against your own history. It only speaks once there's enough data behind it.
Mistakes
The leak, ranked and trended
A waterfall of every tagged mistake and a sparkline on your single biggest leak, so the pattern is visible before it costs the account.
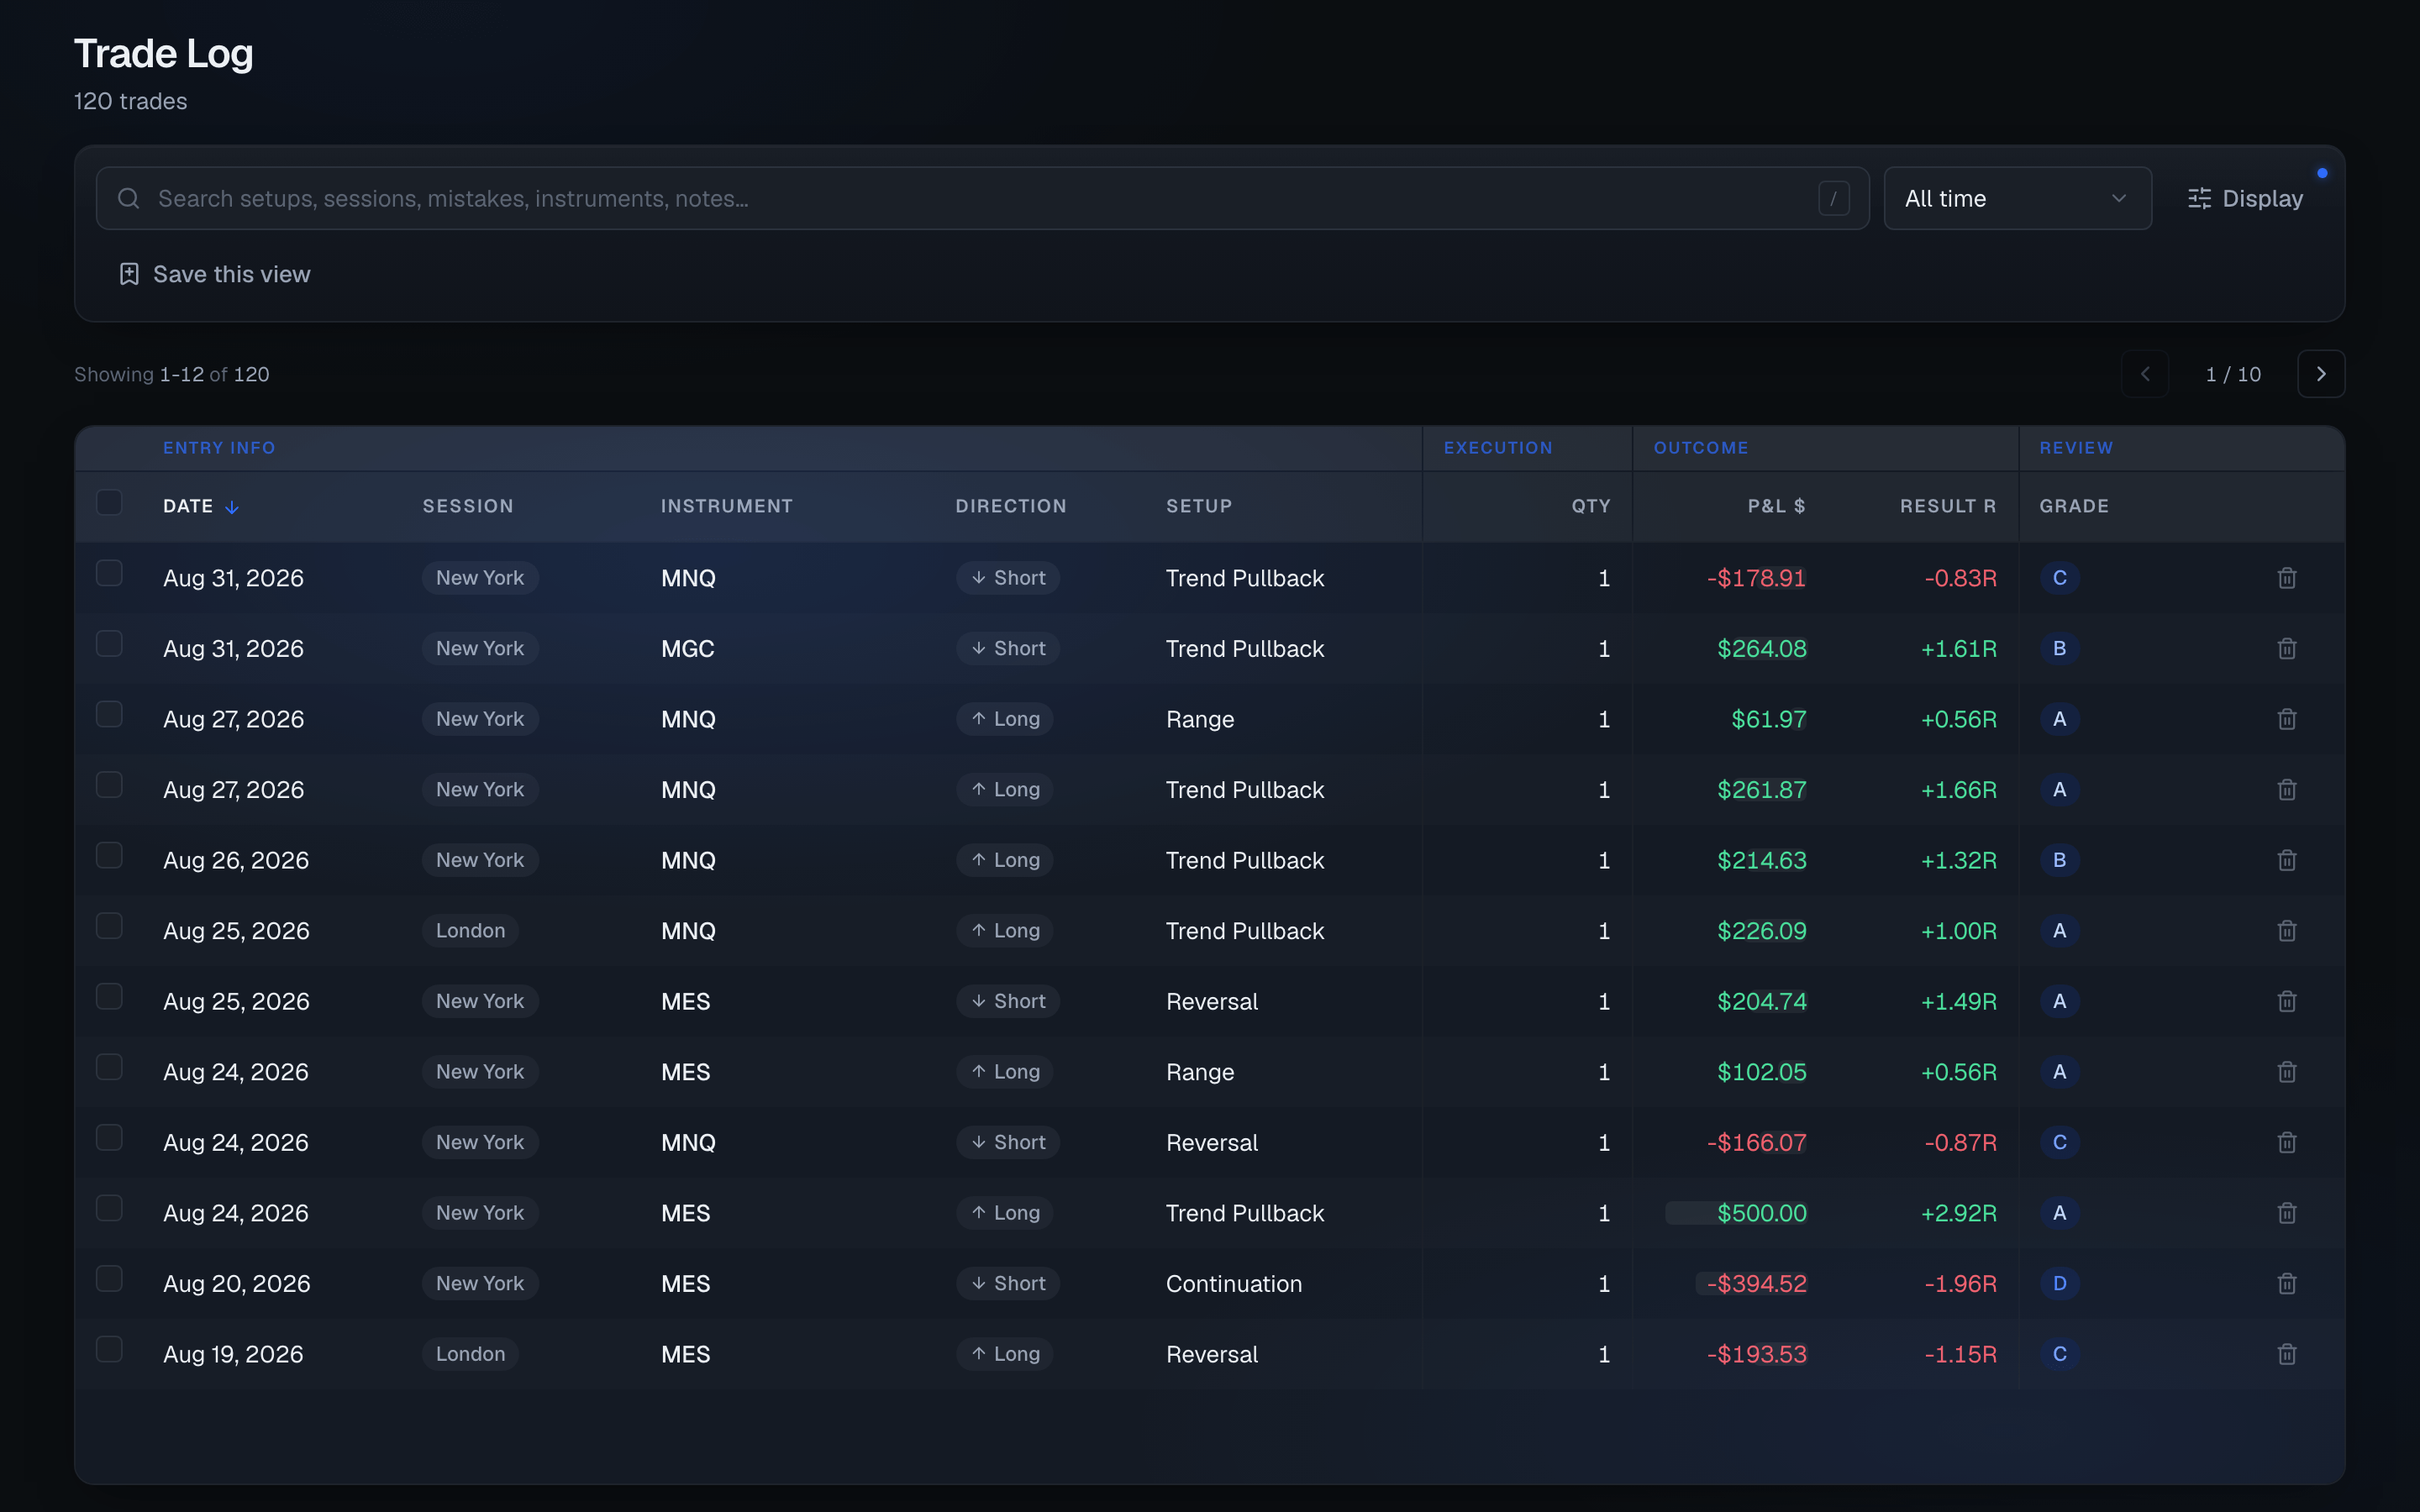
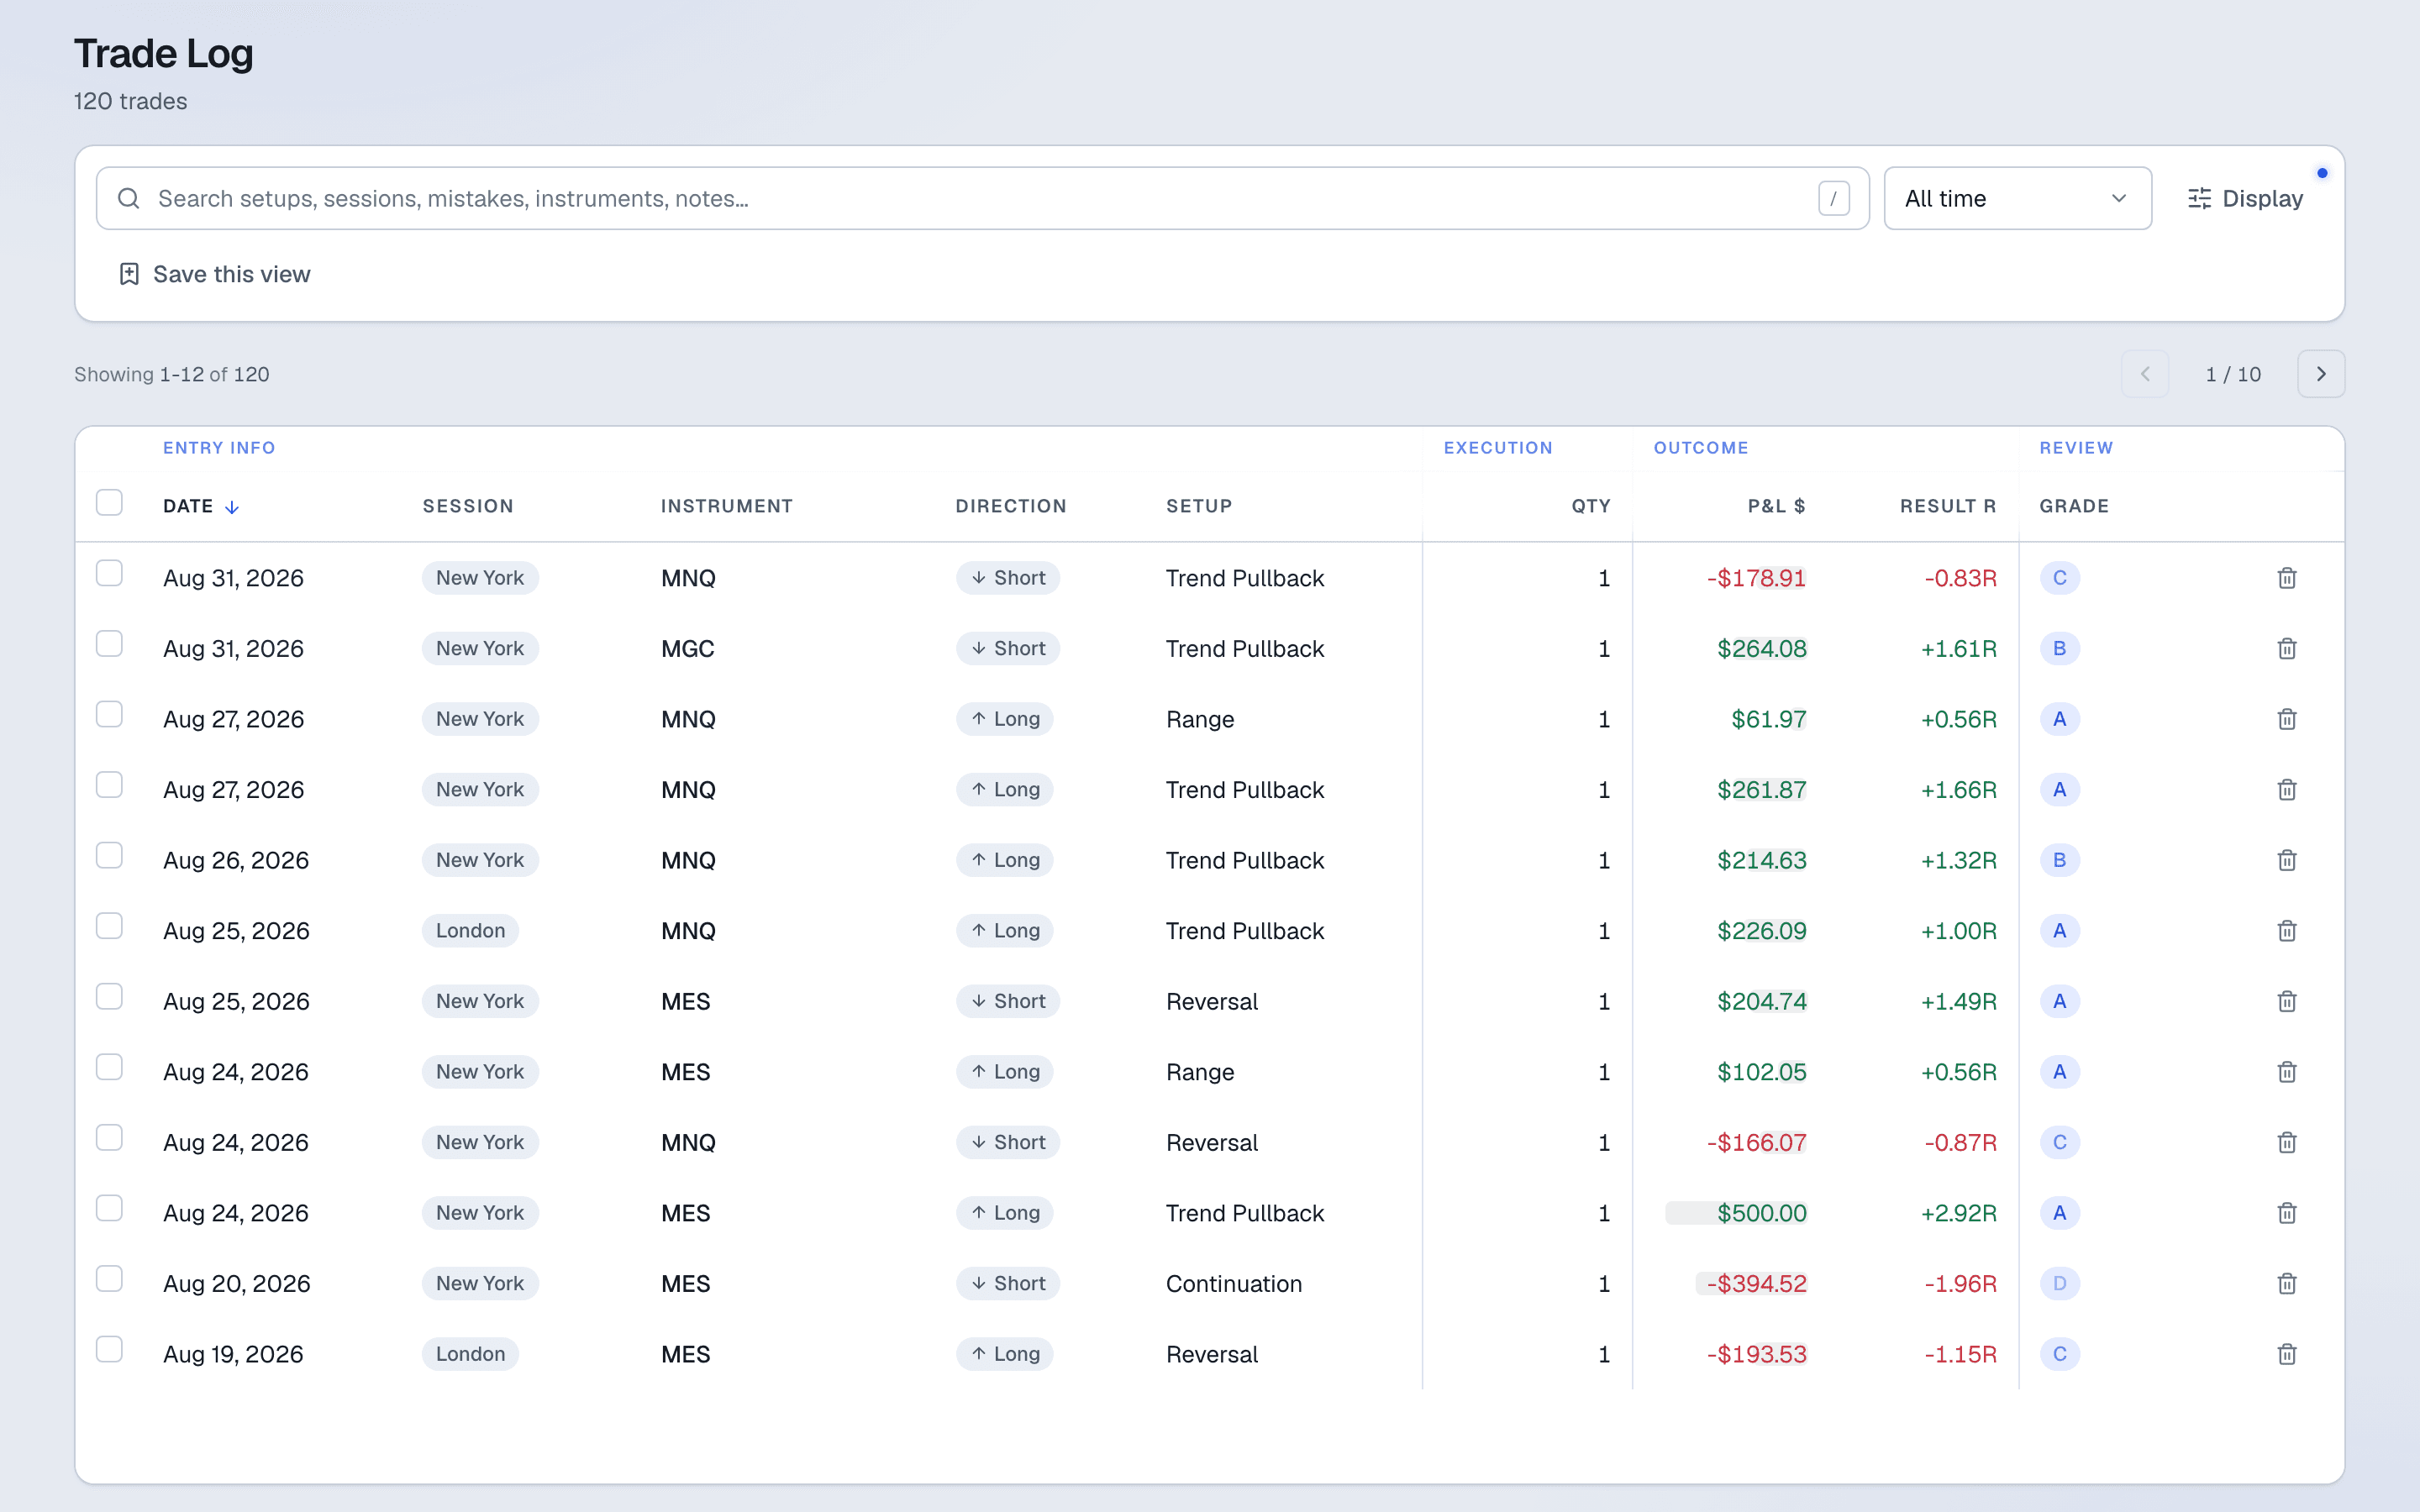
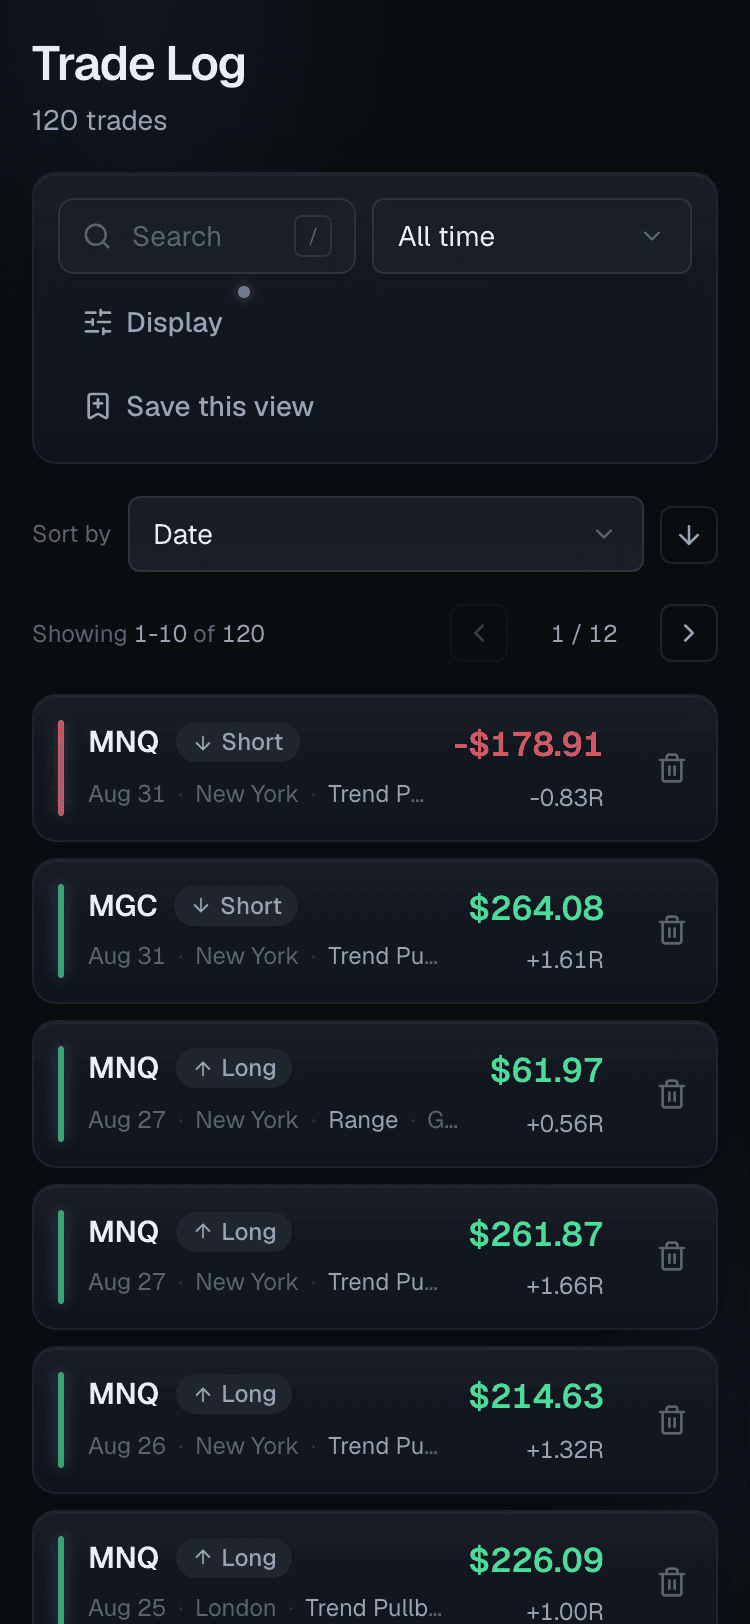
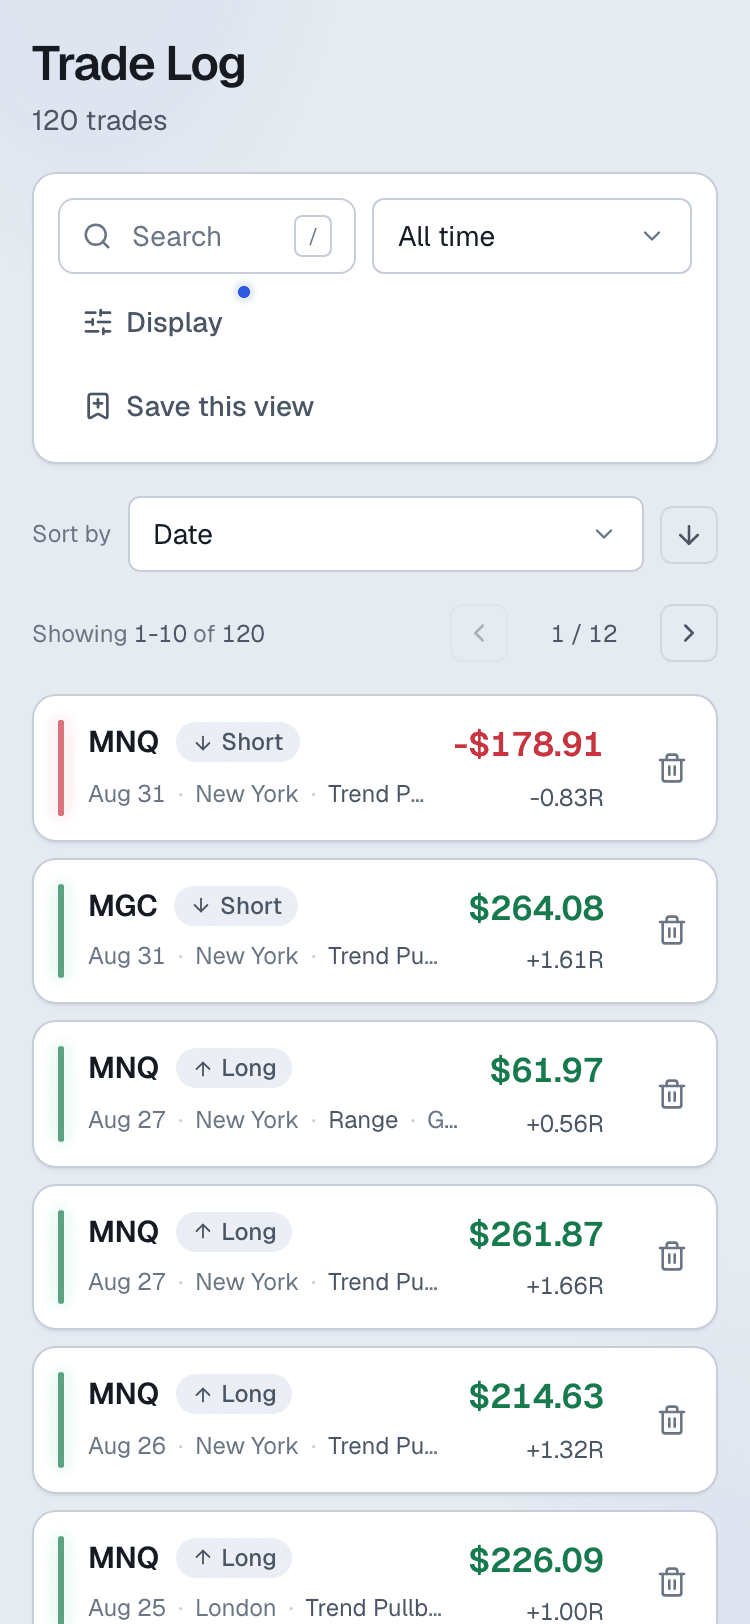
Trade log
Every trade, and why you took it
Entry, execution, outcome and your own notes in one table you can sort, filter and save a view of. The record the rest of the app reads from.
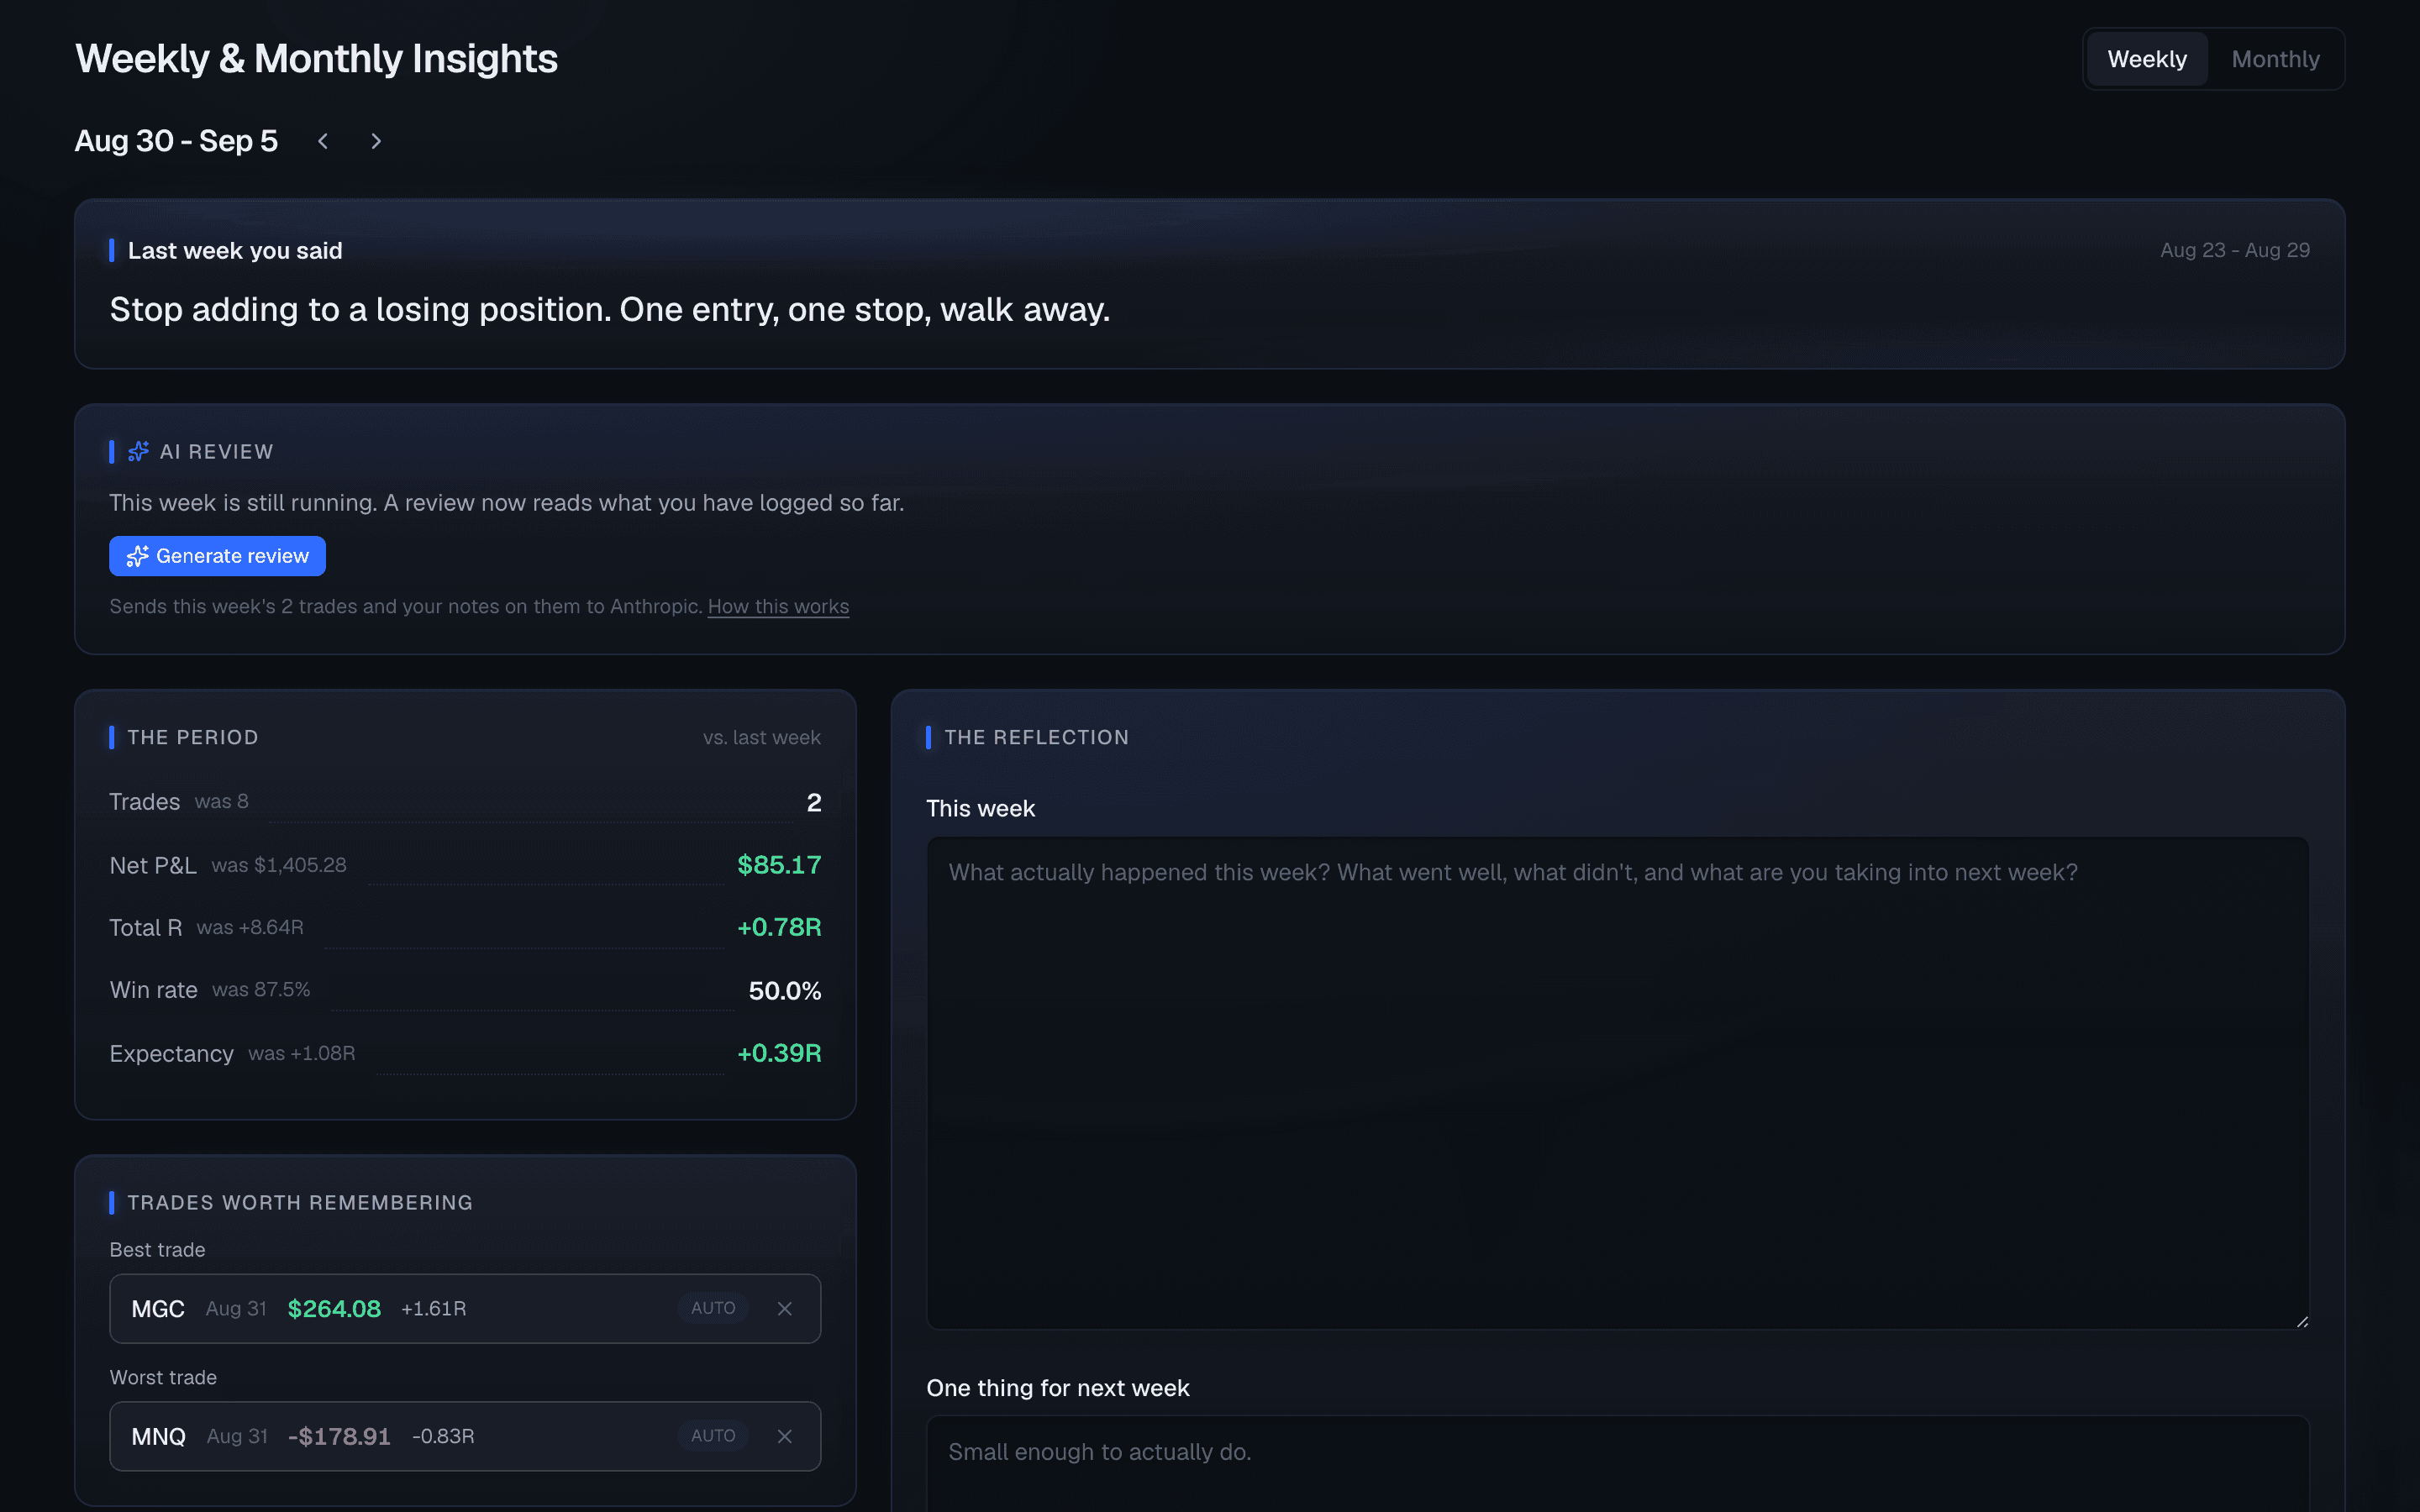
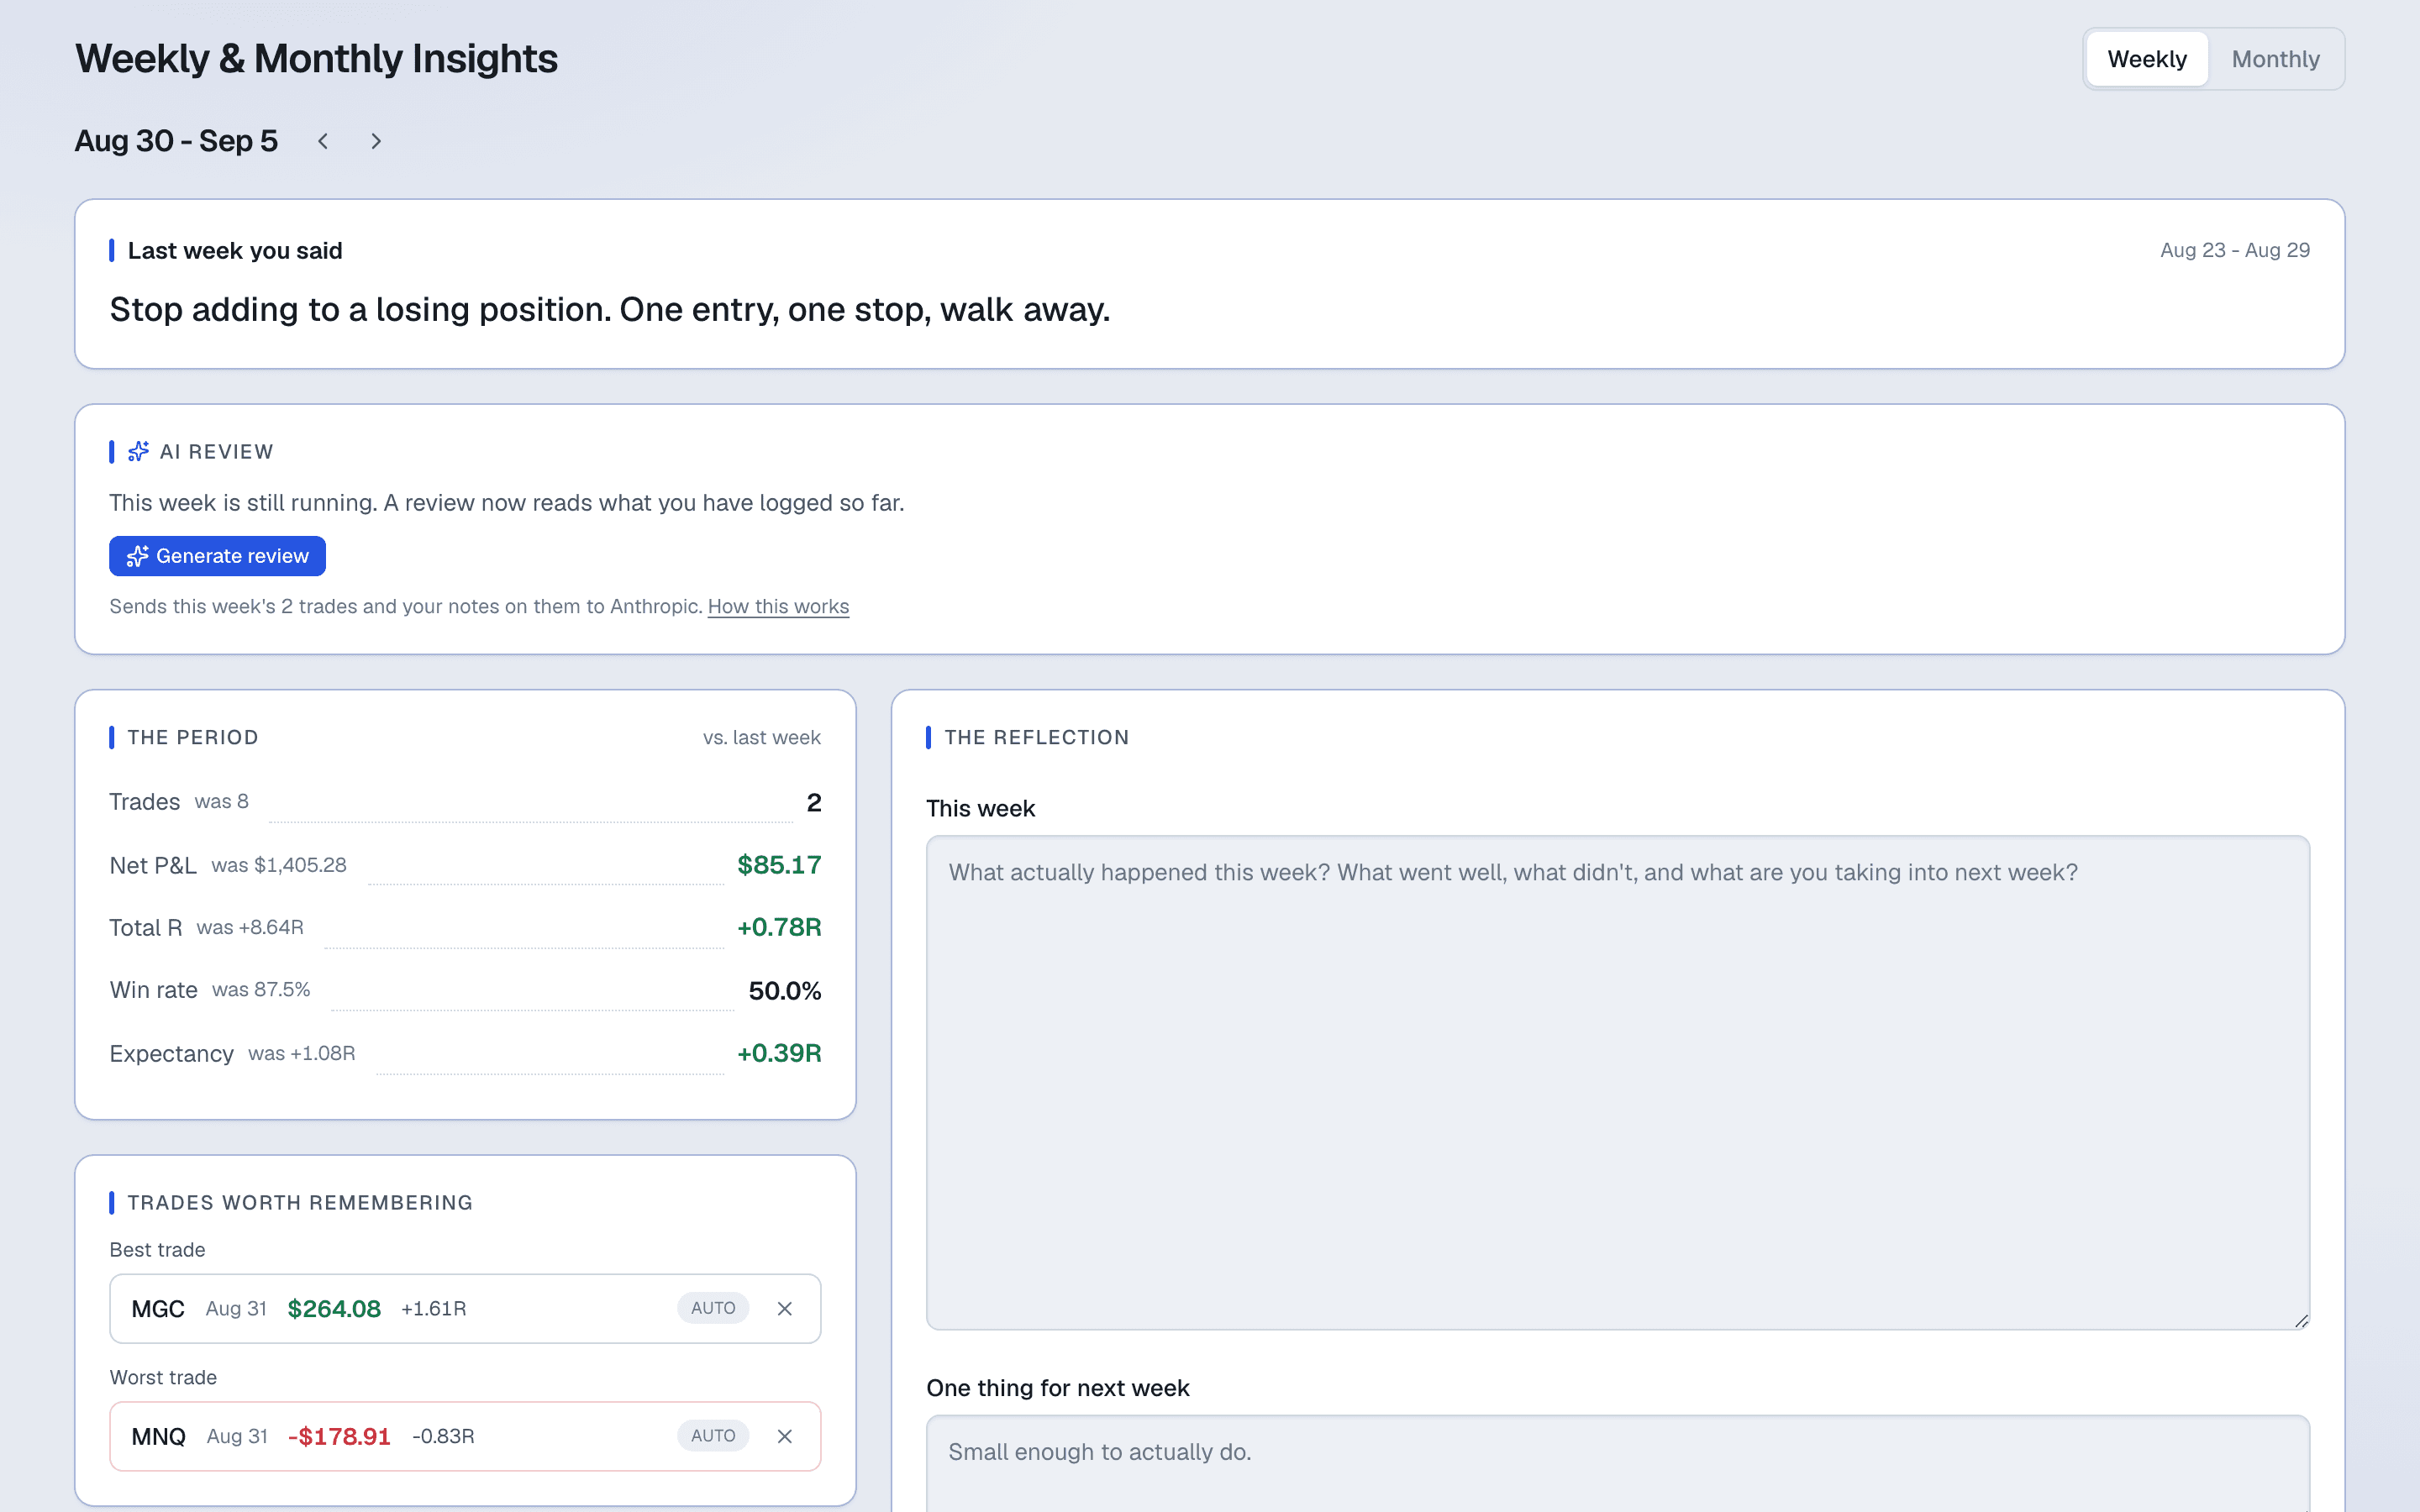
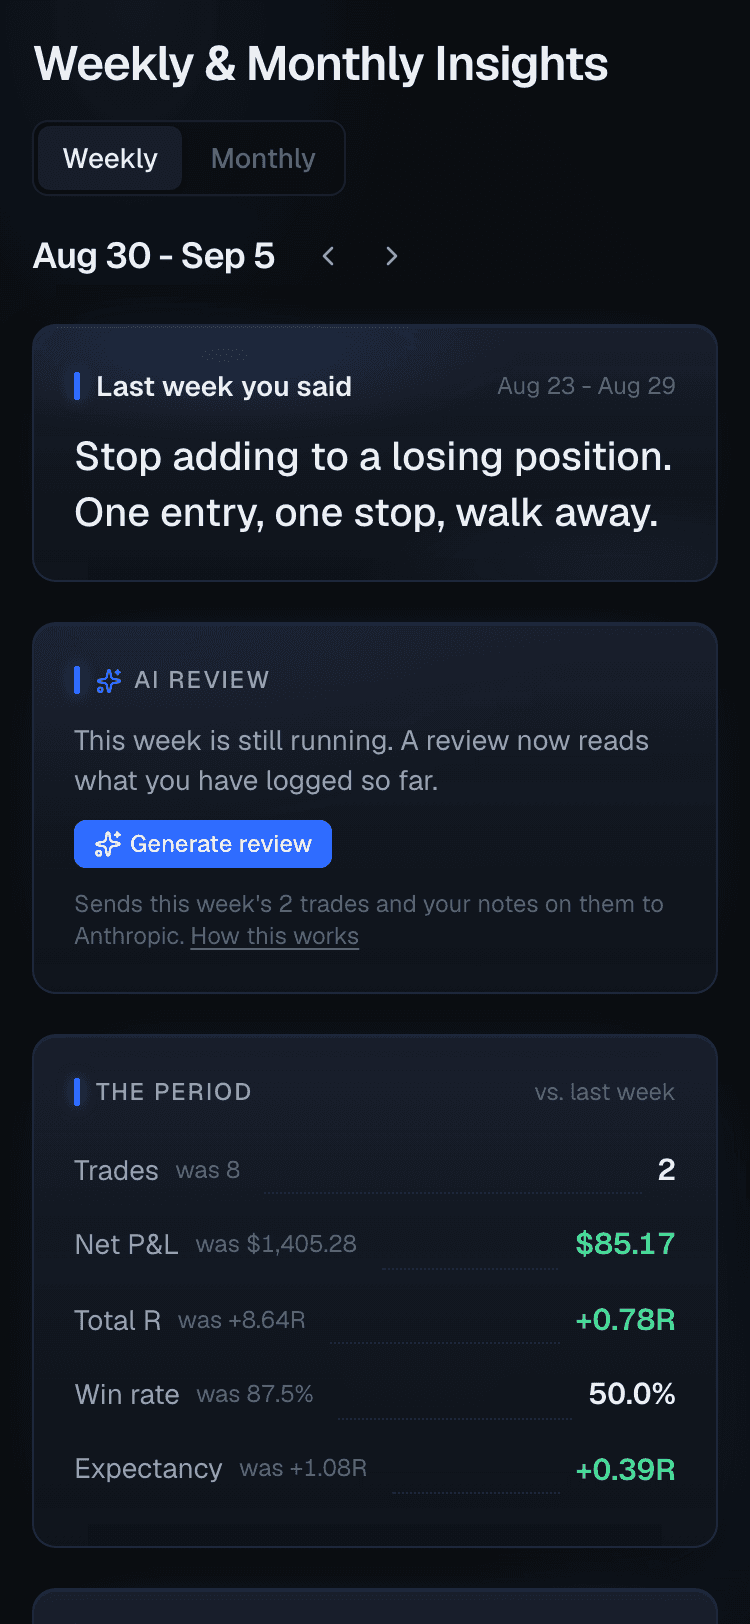
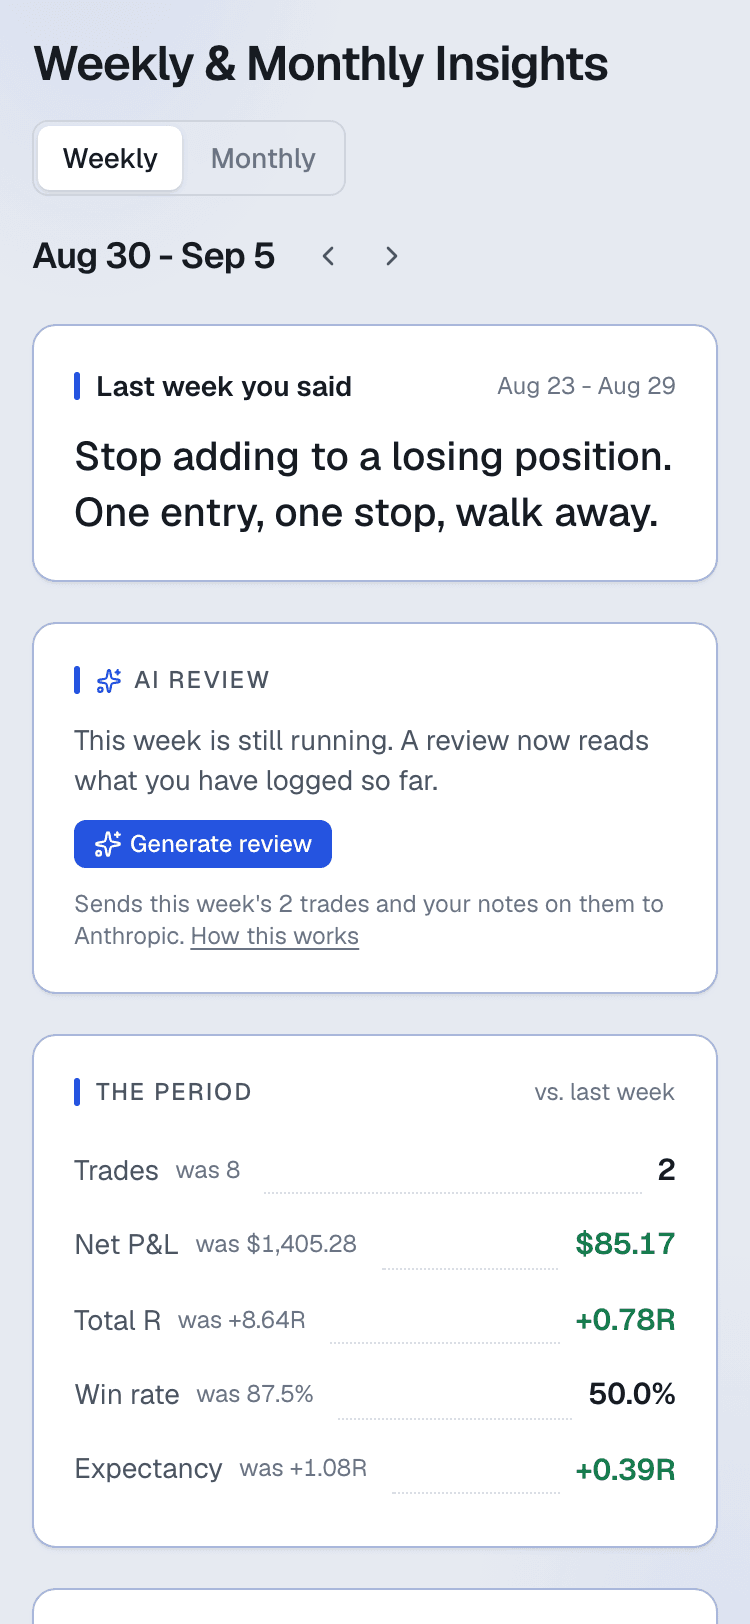
Weekly & monthly insights
Close the loop, not just log it
Manual reflections that carry your last focus forward automatically, so what you told yourself to work on doesn't quietly disappear.
Your data is yours
A journal only works if you are honest in it, and nobody is honest in a notebook they think someone else is reading.
No account can read another's rows
Access is enforced in the database on every table, not by the app remembering to check. It is the first rule the schema is held to.
Your journal stays in the EU
Trades, notes and account data are stored on EU infrastructure. The AI features, when you turn them on, are the one thing that leaves, and the app says so at the point you switch them on.
Export everything, on every tier
One action, machine-readable, all of it. Not a sales lever and never behind a plan: you should never pay to get your own history out.
Delete it all from inside the app
Your account and its data, removed on request without emailing anyone to ask permission.
The full detail, including every processor and what each one receives, is on the privacy page.
Free & Pro
Everything ships free at launch. The split below is the target, not the launch state. Pro doesn't exist yet, and this page says so plainly.
Free
$0
A usable journal on its own, not a demo. You never pay to see your own data.
- Fast trade logging + full trade log
- Dashboard, core statistics, Mistakes Tracker
- Manual weekly & monthly reflections
- One trading account
- CSV export: every tier, forever
- CSV importpost-launch
Pro
~$19/mo
Leverage, not access. Pro adds depth across time and breadth across accounts. Not built at launch.
- AI per-trade reviews & weekly/monthly reportspost-launch
- AI chat over your own datapost-launch
- Multiple trading accountspost-launch
- Full history in analyticspost-launch
- Personalized prop-firm account pagepost-launch
On the roadmap
Honestly labelled: none of this is in the app yet, and nothing above this line depends on it.
AI per-trade reviews
An honest read on a single trade, on request.
AI weekly & monthly reports
The same reflection, with a model helping you see it.
AI chat over your own data
Ask questions about your own history. Nothing else.
Strategy builder
Describe a strategy, get stats scoped to it.
Backtesting
Test an idea against history before risking it live.
Prop-firm account page
Drawdown and daily-loss limits, tuned to your firm's rules.
CSV / broker import
Bring existing history in, not just log forward.
Questions
Is this financial advice?
No. Traquil is a journal and analytics tool. It shows you your own history back clearly. It never tells you what to trade.
Is it free?
Yes, everything ships free at launch, including the core journal, dashboard, and Mistakes Tracker. A Pro tier with AI features and multi-account support is planned for later, and it will add depth, not gate access to your own data.
Can I import my existing trade history?
Not yet. CSV / broker import is on the roadmap but not built at launch. You can log trades forward right away, and export your data anytime on every tier.
Is my data private?
Yes. Your journal is stored on EU infrastructure, every table is access-controlled at the database level so no account can read another’s rows, you can export everything you have put in at any time on any tier, and you can delete your account and its data from inside the app. Read the full details on the privacy page.
Who is Traquil built for?
Funded and aspiring-funded prop-firm futures traders trading intraday with a hard drawdown limit. If you've bounced off a spreadsheet or a journal that only shows P&L, this is built for you.
What makes it different from a spreadsheet?
A spreadsheet records what happened. Traquil reads it back to you: which mistake is costing the most, whether your confidence tracks your results, and what you said you would work on last week. The logging is the cheap part; the reading back is the product.
Start seeing your trading clearly
Log your next trade, and let the journal tell you something you did not already know about the last hundred.
Free while in early access, and early access means early: some of what is on this page is still on the roadmap, and it is labelled where it is.